Gantt Chart in Construction | Creation | Benefits | Examples
Construction task management is one of an organization’s most essential and integral functions. It helps to manage and monitor tasks efficiently. Managers and project team members can see their respective tasks and associated resources.
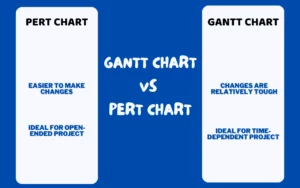
Gantt chart for building construction helps us create a graphical representation of a project’s scheduled activities, milestones, and deliverables. A construction company can use this to increase productivity as it clearly illustrates which tasks are completed at what time throughout the project lifecycle.
But, you might wonder how and where to create such a chart for your next project. Well, we’ll do everything in this article to answer those questions regarding the Gantt chart in construction.
Construction Gantt Chart: An Overview!
A Gantt chart in construction is a project management tool that visually represents the tasks, activities, and milestones of a construction project. Each task is represented by a chart bar showing the start date and end date. The bars can be color-coded to indicate different tasks, such as design or construction.
Benefits of Gantt Charts in Construction
In construction, Gantt charts make identifying dependencies between tasks and resources more accessible, which is especially important for complex projects with multiple stakeholders.
Helps Identify Dependencies
A multiphase construction Gantt chart is a visual representation of your project schedule. It shows tasks, who is responsible for them, when they are due and how long they will take. This helps you identify conflicts or dependencies with other team members’ work.
Single Version of the Truth
With a Gantt chart for building construction, you have one source for all information about your project’s schedule. The information is stored in one place, so there are no conflicting versions or confusion about what needs to be done next.
Real-time and Widely Understood
A Gantt chart is an effective way to communicate the progress of a project to stakeholders and team members alike. It provides an easy way for everyone involved to see what needs to be done next and when it should be completed. This makes it easier for everyone to stay on track with their tasks since they can see where others are at any particular time.
Example Gantt Chart for Construction Project
An example Gantt chart for construction project could look like this:
Planning phase:
Create a Gantt chart for building construction showing how long each task will take and when it will start and end. This will help you estimate costs and determine the resources needed to complete your project on time and within budget.
Execution phase
Use the Gantt chart in construction to monitor progress during execution so that you stay on time and spend your budget effectively during this critical period of execution. Keeping tabs on tasks also helps reduce risk because it allows you to identify any issues early on so they can be addressed before they become significant problems.
Completion phase
In this phase, the tasks that need to be completed at the end of the project are identified. This includes ensuring the finalization of all documents and site clearance— from equipment— before leaving the site.
How do you use a Gantt chart for construction projects?
Here’s how to use a Gantt chart in construction projects:
Gather Necessary Information
You’ll need to gather all the necessary data to create your project schedule. This includes:
- The complete list of doable tasks (you can use our template here)
- Start and end dates for each task (task duration)
- The resources required for each task (personnel or equipment)
Note Task Dependencies
When creating your Gantt chart, note any dependencies between tasks so that you can meet all of the critical deadlines and avoid delays due to resource constraints.
Identify Roadblocks and Risks
To begin, you need to understand the nature of your project. For example, if there’s any possibility that weather will hinder construction, then consider the weather and associated things as important factors. You should also identify any potential problems or issues before they arise (for example, rejection of permit application).
Create a Detailed Task List
This step requires research and planning on your part. In your multiphase construction Gantt chart, include all project tasks — from buying materials and hiring employees to install equipment to finishing up construction details. In short, the more detailed this list is, the easier it will be to create an accurate schedule that meets all deadlines.
Input Information into a Gantt Chart Template
When creating your multiphase construction Gantt chart template, make sure that all dates are accurate. In addition, ensure complete elaboration of each task and its further break down into smaller pieces.
Final Words
A Gantt chart in construction is a valuable management tool that shows the progress of construction elements over time. The Gantt chart contains a list of tasks and their estimated durations, but it can also contain dependent tasks. This makes it a powerful tool for managing large-scale construction projects and keeping tabs on deadlines, costs, and work completion dates.
One should try ProSchedular for better management of Construction Gantt charts.
FAQ
How are Gantt charts used in engineering?
Practically, Gantt charts are useable in all engineering projects. But they’re especially accommodating for large-scale construction projects. This is because they show the sequence of doable tasks, who’s working on each task, and how long each task will take.
Gantt charts also make it easy to see where there might be delays or problems with the project schedule, which can help you adjust your strategy accordingly.
Additionally, industry experts often use them as tools for project management. These can also be used to report progress on a project to clients or other stakeholders. For example, you can create a Gantt chart showing how many hours each team member has worked on a project and how much time remains until completion.
What are 3 things included in a Gantt chart?
Gantt charts in construction consist of three main components:
- Milestones – these are significant events in your project, such as when you expect to complete each phase of work.
- Tasks – smaller tasks that contribute towards completing your milestones; they often have start and end dates.
- Dependencies – these show when tasks must be completed before other tasks can start (and vice versa).