Today, managing projects often involves blending traditional and agile methods, known as hybrid project management. To keep these projects on track, many managers turn to Gantt charts. These tools help plan and monitor tasks, ensuring everything runs smoothly. In this blog, we’ll explore how Gantt charts can optimize workflows in hybrid project management, making your project management both effective and efficient.
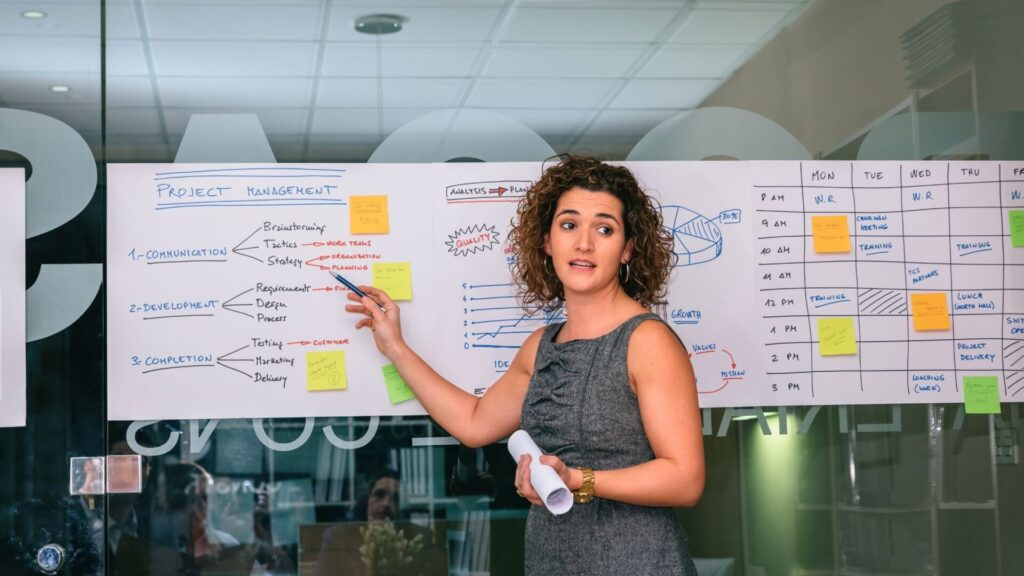
What is Hybrid Project Management?
Hybrid project management is a smart way of handling projects that mixes traditional and agile methods. This style lets teams use the best parts of both approaches depending on what the project needs.

Think of traditional project management as a straight road map. You plan everything early, step by step, which works great for projects that don’t change much along the way. This method is perfect for things like building a house or making a new car.
Agile project management, however, is more like exploring a city with a flexible plan. It’s great for projects that might need changes as you go, such as developing a new app or designing a website.
Hybrid project management combines these two. It lets you plan some parts of the project in detail, while other parts can change if needed. This way, you can be well-prepared but also ready to adapt to new challenges or opportunities.
This mix makes hybrid project management especially useful today, where things often change fast. It helps teams be both organized and flexible, making it easier to succeed in their projects.
What are the pros and cons of hybrid project management?
Hybrid project management offers a versatile approach to handling projects, but like any method, it comes with its own set of advantages and challenges. Here’s a breakdown to help you understand if it’s the right fit for your project.
Pros:
- Flexibility: Hybrid methods allow teams to switch between structured and agile practices as needed. This flexibility means you can adjust your approach based on the project’s phase or unexpected changes, ensuring adaptability.
- Efficiency: By choosing the most effective practices from both traditional and agile methodologies, teams can achieve their goals faster and more efficiently.
- Risk Management: The traditional part of hybrid project management helps in detailed upfront planning, which can reduce risks associated with budget and timelines. Meanwhile, the agile part allows for ongoing revisions and updates, which helps in quickly addressing issues as they arise.
- Client Satisfaction: Hybrid project management often results in higher client satisfaction because it allows for regular updates and changes based on client feedback, while still keeping a clear overall timeline and budget in view.
Cons:
- Complexity: Managing two different methodologies at once can be complex. It requires well-defined processes and clear communication to ensure that everyone understands which approach is being used and when.
- Resource Allocation: Switching between methodologies can lead to challenges in resource allocation. Team members may need to shift roles or tasks more frequently, requiring flexibility and quick adaptation.
- Training Needs: Team members may need training in both traditional and agile methodologies, which can be time-consuming and costly.
- Potential for Conflict: Different team members might prefer different methodologies, leading to disagreements or conflicts about the best way to proceed, especially under pressure.
Understanding these pros and cons can help you decide if hybrid project management is suitable for your project, ensuring you’re prepared to leverage its benefits while managing its challenges effectively.
What is a Gantt Chart?
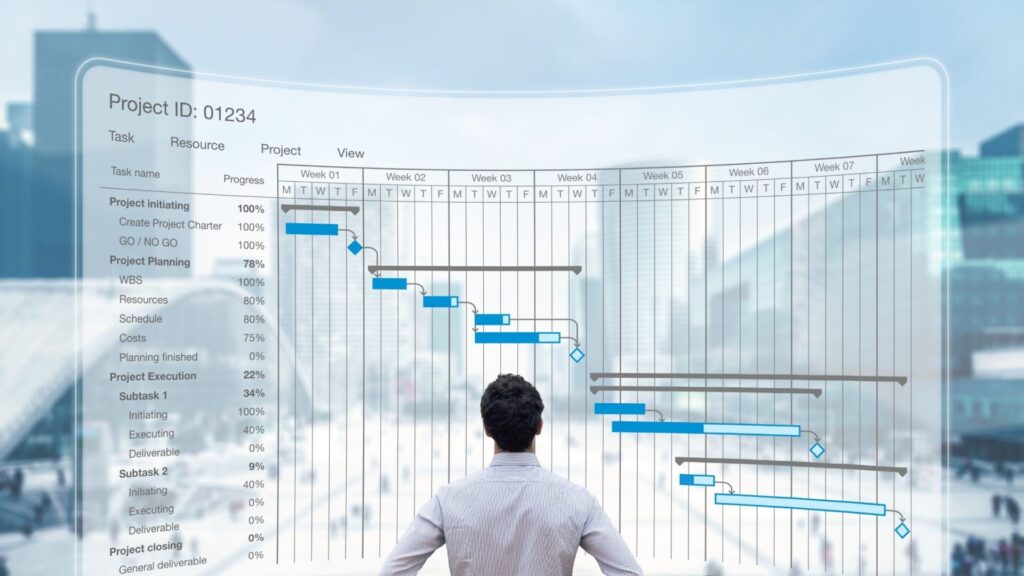
A Gantt chart is a popular project management tool that helps teams see the timeline of a project at a glance. It’s a type of bar chart that shows the start and finish dates of different tasks or stages within a project. Each bar on the chart represents a specific task, making it easy to track progress and see how tasks overlap and connect.
Here’s what a Gantt chart typically includes:
- Tasks: Listed on the vertical axis, showing what needs to be done.
- Timeframe: The horizontal axis represents the timeline, from the start to the end of the project.
- Bars: Each task has a bar that shows when the task starts and ends.
- Dependencies: Lines or arrows that connect tasks that need to happen in a certain order.
- Progress: Often, the bars are shaded to show how much of the task is completed.
Gantt charts are very useful because they provide a clear, visual representation of a project’s status, which helps in planning and coordinating efforts, especially in complex projects.
Using Gantt Charts for Hybrid Project Management
In hybrid project management, combining the flexibility of agile with the structure of traditional methods, Gantt charts prove incredibly effective.
- Planning and Scheduling: Gantt charts aid in setting realistic timelines for structured project phases, while allowing flexibility in iterative, agile phases.
- Visibility and Communication: They offer a clear visual that the entire team, including stakeholders unfamiliar with detailed project management tools, can share. This enhances understanding and communication across different groups.
- Tracking Progress: By updating the Gantt chart as tasks are completed or adjusted, project managers can quickly see which parts of the project are on track and which might need more attention.
- Managing Dependencies: In hybrid projects, some tasks may follow a strict order while others are more flexible. Gantt charts make it easy to see these relationships and manage dependencies effectively.
- Resource Management: They can show when team members are needed for specific tasks, helping to balance workloads and plan for resource allocation between structured and agile tasks.
Using Gantt charts in hybrid project management provides a blend of visibility and flexibility, which can help in managing the unique challenges of these projects more effectively.
Benefits of Gantt charts for hybrid project management
Gantt charts are particularly useful in hybrid project management environments, where they bring numerous benefits that help streamline processes and improve project outcomes. Here are some of the key advantages of using Gantt charts in this context:
- Enhanced Project Visibility: Gantt charts show the entire project timeline, clarifying task relationships and project structure.
- Improved Coordination: Gantt charts show task start and end times, aligning team members—essential in hybrid environments with traditional and agile tasks.
- Better Resource Management: A clear timeline lets managers allocate resources effectively, preventing bottlenecks and overallocation in complex projects.
- Flexibility in Tracking Progress: Gantt charts support dynamic updates, crucial for hybrid project management, keeping teams agile as tasks and timelines change.
- Risk Mitigation: Gantt charts’ clear structure identifies risks early, highlighting scheduling delays or conflicts, allowing for proactive measures.
- Facilitating Communication: Gantt charts effectively communicate progress to team members, stakeholders, and clients, helping set realistic expectations and maintain trust.
Gantt charts easily integrate with other project management tools and systems, enabling a comprehensive management approach leveraging various methodologies’ strengths.
Example of Using Gantt Charts in Hybrid Project Management
Consider a hypothetical project to illustrate how Gantt charts effectively function in a hybrid project management setting. The project involves developing a new software application, comprising predictable tasks planned in advance and agile tasks responding to changing client needs.
Project Setup
Phase 1: Initial Planning and Design (Traditional)
- Tasks: Requirements gathering, scope definition, initial design mock-ups.
- Duration: Month 1 to Month 2.
Depicted as consecutive bars on the Gantt chart, showing a clear start and end date.
Phase 2: Development Sprints (Agile)
- Tasks: Coding sprints for various application modules.
- Duration: Month 3 to Month 6.
Each sprint appears as a separate bar, overlapping slightly to indicate ongoing development and review cycles.
Phase 3: Testing and Quality Assurance (Traditional)
- Tasks: System integration testing, user acceptance testing, bug fixing.
- Duration: Month 7 to Month 8.
The layout sequentially arranges tasks with clear indications of dependencies, showing that testing cannot begin until development sprints are complete
Phase 4: Implementation and Training (Traditional)
- Tasks: Deployment of the software, training for users, final adjustments based on feedback.
- Duration: Month 9 to Month 10.
You can mark these final tasks on the Gantt chart to ensure all resources align for a successful project closeout.
Visualization
The Gantt chart for this project would clearly depict each phase with its respective tasks. Arrows indicate dependencies between tasks, like completing design mock-ups before starting development sprints. You can update progress in agile sprints in real-time, showing how much you have completed of each sprint at any moment.
Dynamic Use
As the project progresses, you can dynamically update the Gantt chart. For instance, if a development sprint takes longer than expected, you can adjust the subsequent bars (tasks) to reflect the delay.This keeps everyone aware of the new timelines and helps manage expectations and resource planning accordingly.
Communication Tool
The completed Gantt chart communicates to teams, stakeholders, and clients. It visually presents updates, clarifying project status and changes.
This example demonstrates Gantt charts bridging traditional and agile methods by offering structured flexibility. It enhances planning, execution, and communication in hybrid projects.
The ProScheduler plugin for Jira integrates Gantt chart functionality into the Jira interface, enhancing project management. This plugin allows teams to visualize project timelines and dependencies in a clear and interactive format. With ProScheduler, users can easily create, modify, and track tasks over time, align resources, and manage project schedules effectively.
Gantt charts link project planning with agile execution, offering vital organization and visibility for teams.

In summary, Gantt charts are crucial in hybrid project management, offering structure and clarity with needed flexibility for changing demands. Their visual nature and easy-to-update format make them ideal for projects that blend traditional and agile elements.
Related Blogs: