 Welcome to our blog on ‘Project Management Using Gantt Charts in JIRA.’ In this introductory post, we’ll dive into the power of Gantt charts, exploring their relevance in agile project management. Furthermore, we will discuss how to effectively utilize them within the JIRA platform, providing insights and practical tips for enhancing your project management strategy.
Let’s get started on this journey to streamline your project management processes.
Learn Tips for Crafting the Perfect Gantt Chart in Jira
What is the Gantt Chart?
Gantt charts are visual tools used in project management to display tasks, timelines, and dependencies. They were first introduced by Henry L. Gantt in the early 20th century and have since become a fundamental part of project planning and tracking.
At their core, Gantt charts consist of a horizontal timeline that represents the project’s duration, divided into time units (days, weeks, months). Consequently, along this timeline, various tasks and activities are displayed as bars, with each bar illustrating the start and end dates of the tasks. This arrangement thereby provides a clear visual representation of the entire project schedule, making it easier to comprehend and manage the project’s timeline and tasks. Each bar represents a specific task, with its length indicating the task’s duration and its position showing when it starts and ends within the project timeline.
Why are Gantt Charts Valuable in Project Management?
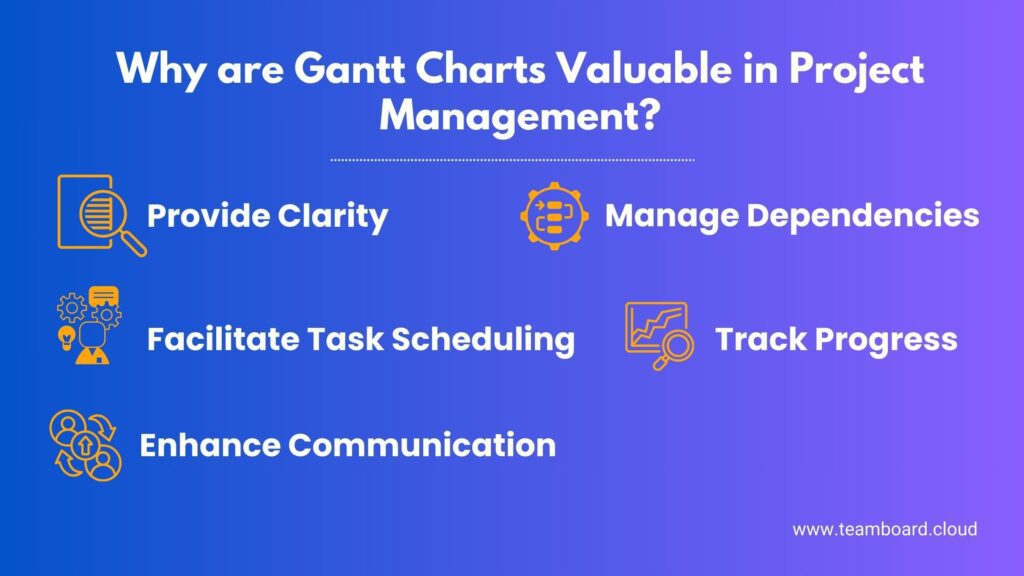
Gantt charts are valuable in project management because they:
- Provide Clarity: They offer a clear visual representation of project timelines, tasks, and dependencies, making it easier to understand project structure.
- Facilitate Task Scheduling: Gantt charts help efficiently schedule tasks, allocate resources, and manage time effectively.
- Manage Dependencies: They show task dependencies, critical paths, and potential bottlenecks, aiding in project planning.
- Track Progress: Gantt charts enable real-time progress tracking, helping teams stay on top of project status.
- Enhance Communication: They simplify complex project plans, improving communication with stakeholders.
How do Gantt Charts Visualize Project Timelines and Tasks?
Gantt charts visualize project timelines and tasks by:
- Horizontal Timeline: Using a horizontal timeline to represent project duration.
- Task Bars: Representing tasks as horizontal bars, where their position along the timeline indicates start and end dates.
- Task Duration: Using bar length to represent task duration, with longer bars for longer tasks.
- Dependencies: Showing task dependencies through connections between bars.
- Resource Allocation: Optionally indicating resource allocation for each task.
- Progress Tracking: Marking completed tasks on the chart to track project progress.
- Milestones: Highlighting important project milestones on the chart.
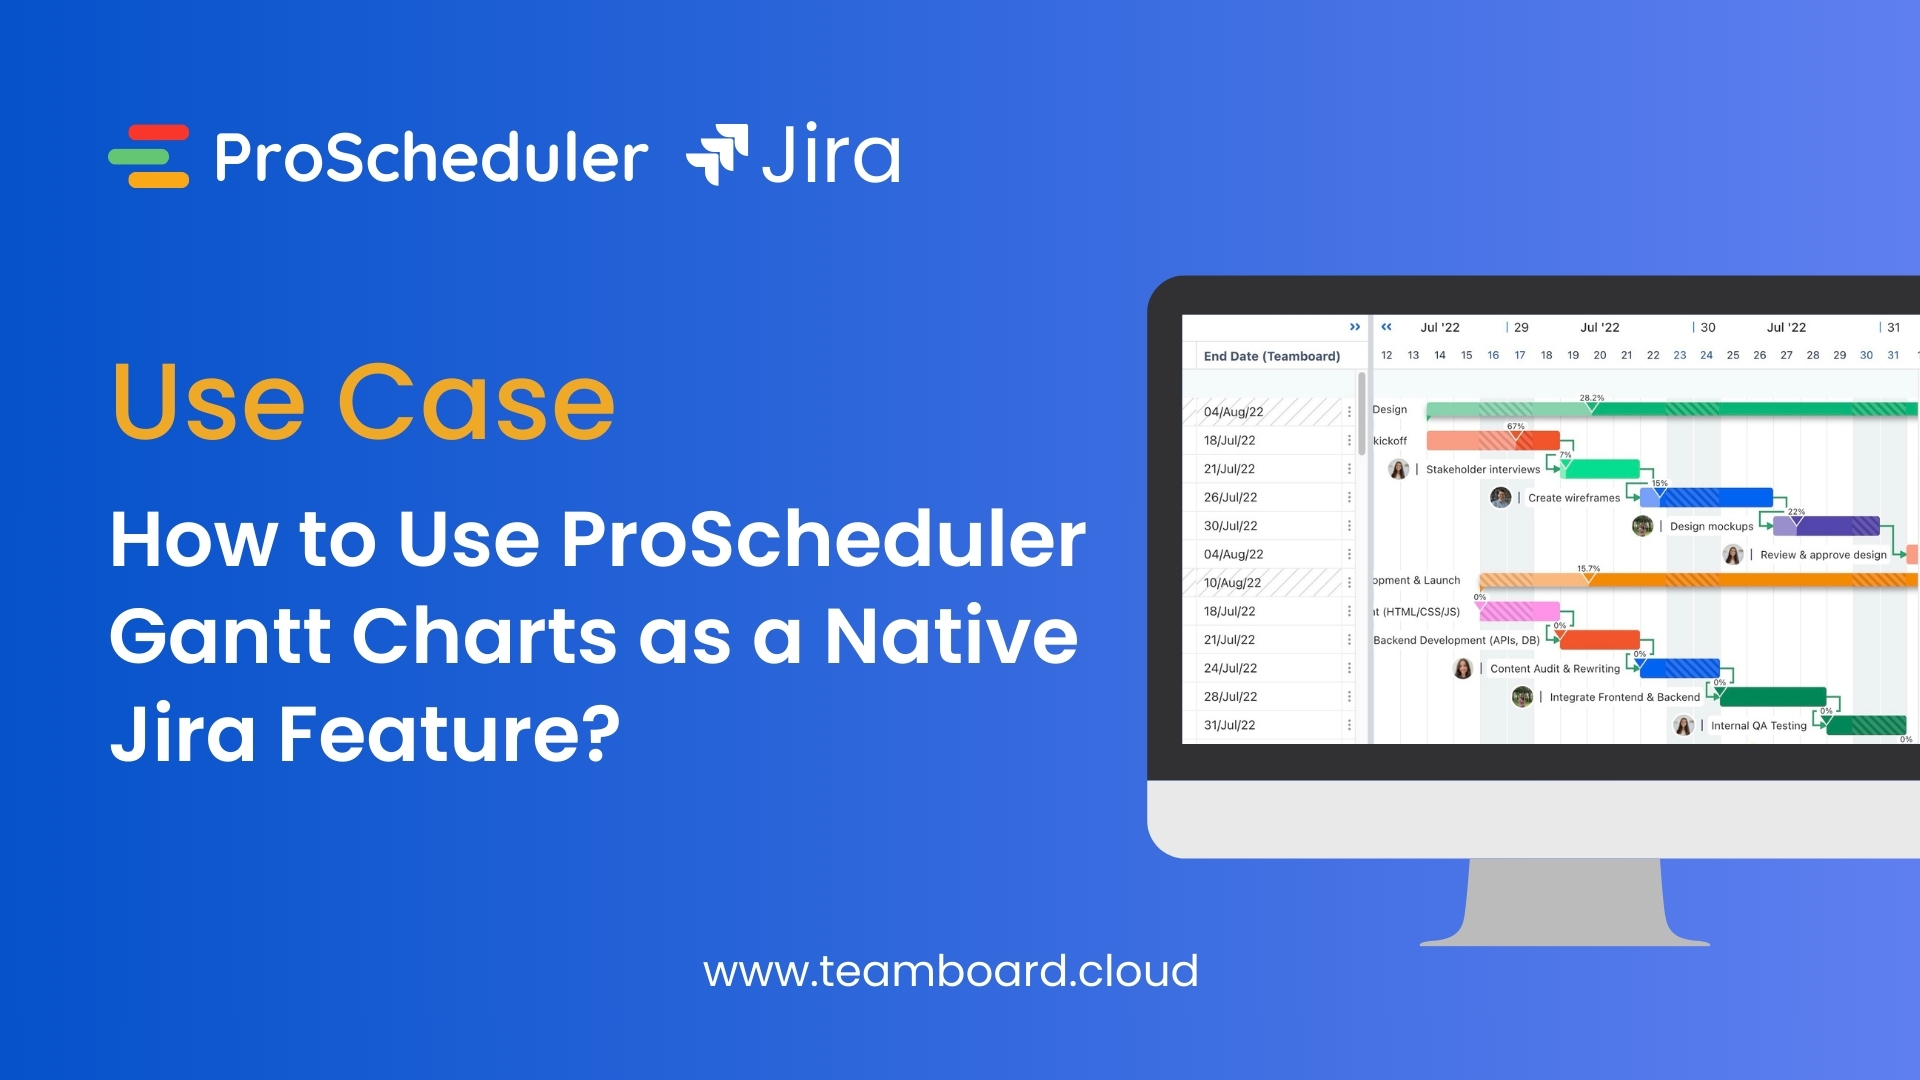
How to Create a Gantt Chart in Jira
Before you begin, ensure that you have the “ProScheduler” plugin installed and configured in your Jira instance. Administrative access may be required for this setup.
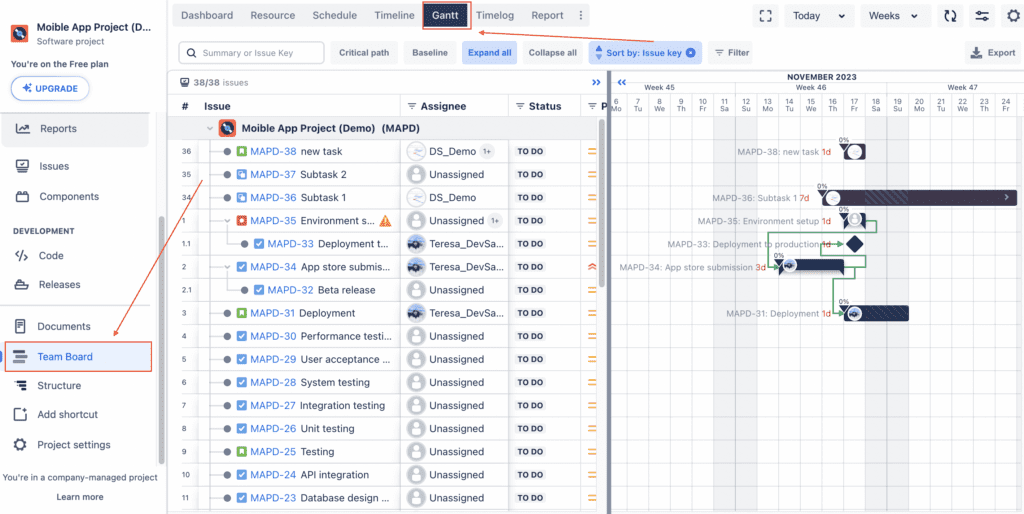
Access Gantt Chart in TeamBoard ProScheduler – Step 1
- Log in to your Jira instance.
- Navigate to the specific project.
- Look for and click on the “TeamBoard ProScheduler” tool or tab.
- Select the “Gantt” tab within ProScheduler.
Create a Gantt Chart for Your Project – Step 2
- By Default, WBS Gantt is Enabled: When you access the Gantt chart for the first time in ProScheduler, the “Work-Breakdown-Structure (WBS) Gantt” is typically enabled by default. This feature automatically copies the current project hierarchy in the timeline and assigns WBS numbers accordingly.
- Task Mapping: The Gantt chart will initially replicate the project’s existing hierarchy, ensuring that tasks and elements are correctly placed within the chart.
- WBS Gantt: It’s important to note that changes made within the Gantt chart after the initial setup may not sync with the Jira Issue hierarchy in the timeline. The Gantt chart retains its own structure, which can be useful for specific project planning needs.
Assign and Plan Resources – Step 3
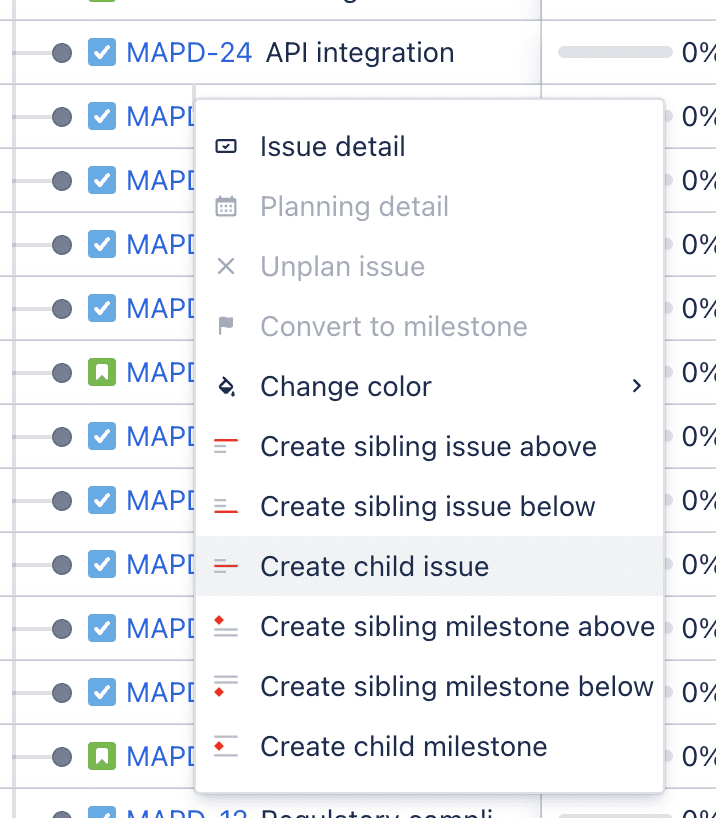
Create Tasks or Milestones: Within the Gantt chart interface, you’ll find options to create various elements such as tasks, events, or milestones. These elements represent the work to be completed during the project.
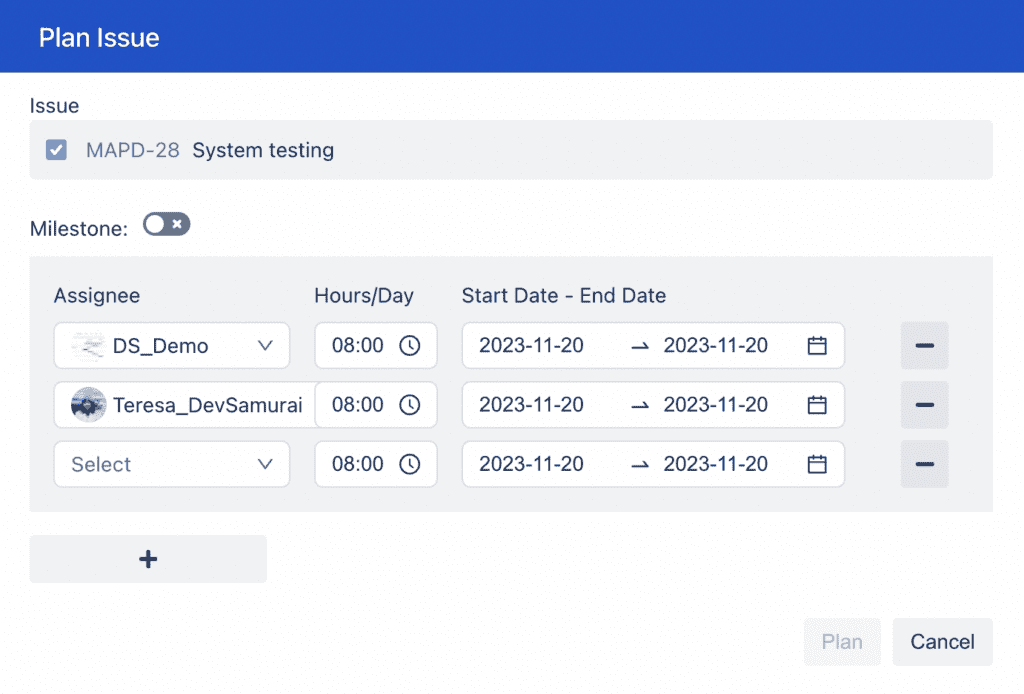
Assign Tasks to Multiple Members: Assign each task to the appropriate team members or resources responsible for its completion. Consequently, effective resource allocation ensures that work is distributed efficiently, optimizing both task assignment and overall project workflow.
Quickly Create New Issues: Some Gantt chart tools within Jira offer the convenience of quickly creating new issues directly within the chart. This feature streamlines the process of adding tasks and their associated hierarchy.
Configure Your Gantt Chart – Step 4
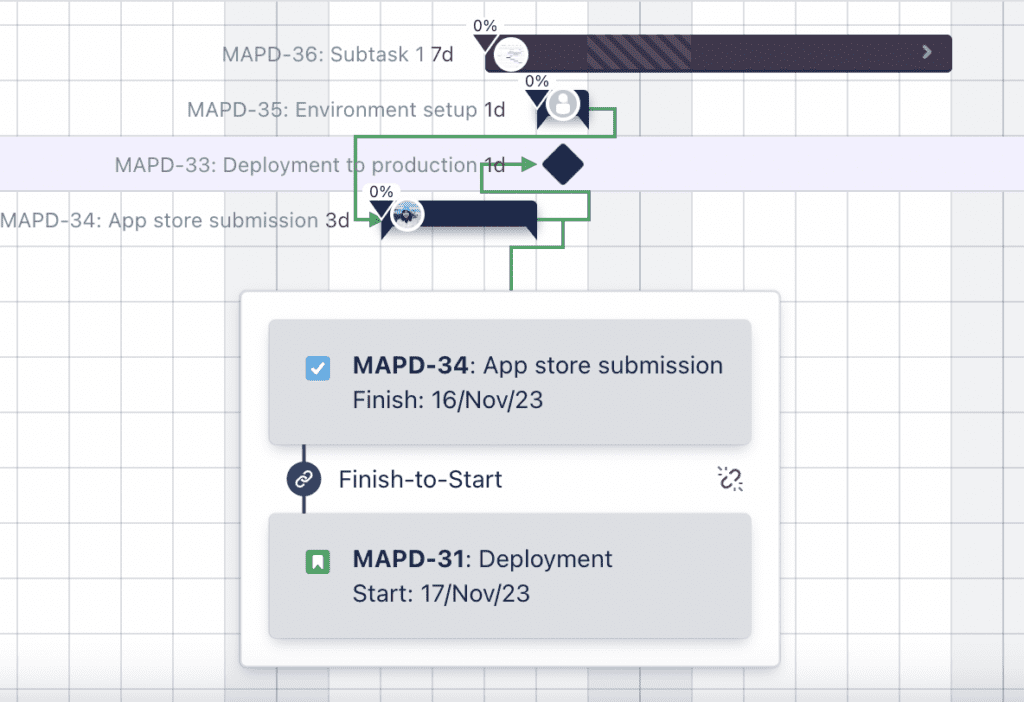
1. Set Up Task Dependencies
Task dependencies are crucial for defining the sequence in which project tasks must be executed. By establishing dependencies within your Gantt chart, you create a structured project plan where tasks are interconnected. This ensures that work progresses logically and efficiently, and it helps you identify potential bottlenecks or delays.
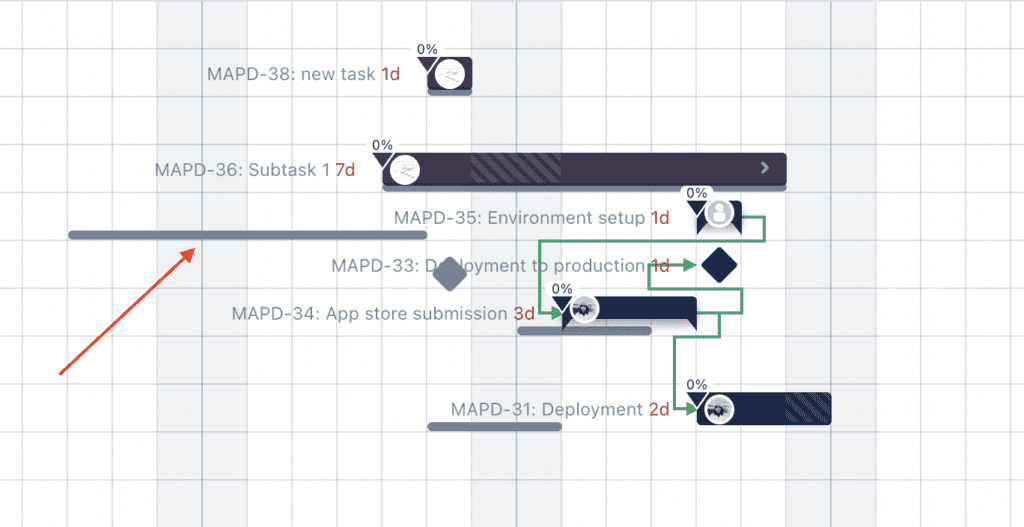
2. Baseline
Creating a baseline involves capturing the original project plan as it stands at a specific point in time. This serves as a reference point against which you can measure changes and deviations throughout the project’s lifecycle. Baselines are invaluable for assessing how well your project adheres to its initial plan and for tracking the impact of any alterations.
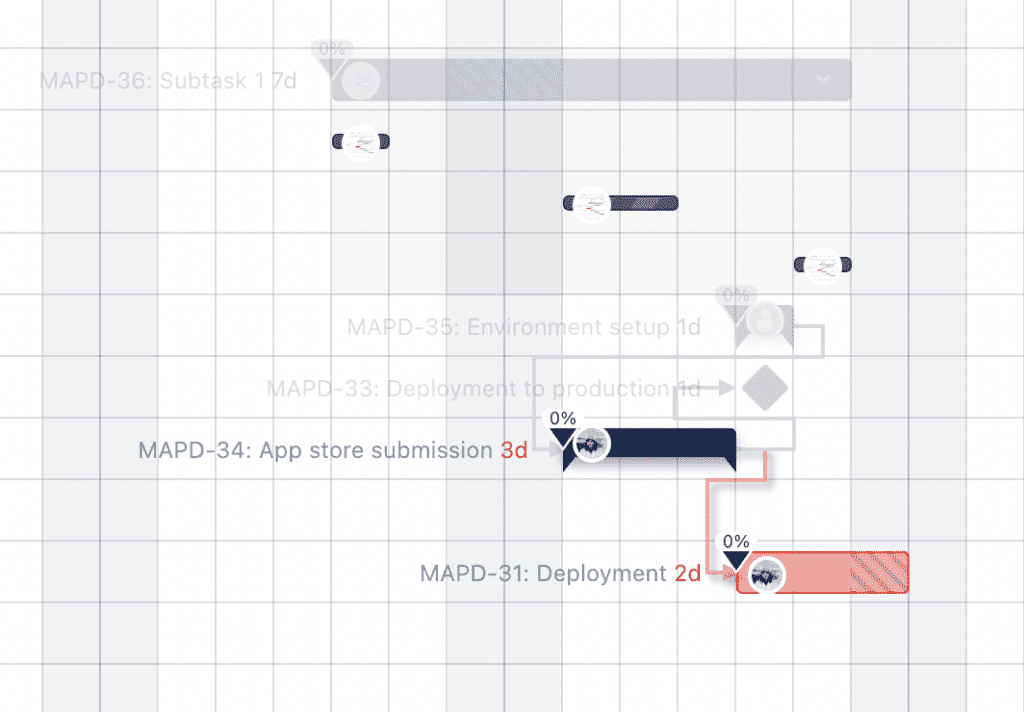
3. Critical Path:
The critical path represents the longest sequence of tasks in your project that, if delayed, would extend the project’s overall duration. Identifying the critical path is essential because it highlights which tasks have the least flexibility in terms of scheduling. By focusing on these critical tasks, you can prioritize resources and efforts to ensure project timelines are met.
4. Drag & Drop to Change Location and Hierarchy
One of the advantages of Gantt charts is their flexibility in adjusting task positions and hierarchies. As a result, you can easily rearrange tasks by dragging and dropping them to new locations within the chart. This feature greatly simplifies the task of adapting your project plan as circumstances change, thereby eliminating the need for complex manual adjustments and ensuring a more dynamic and responsive project management approach.
5. Resize or Drag the Bar to Change Plan
To accommodate changes in task duration or start dates, you can resize or drag task bars within the Gantt chart. This dynamic feature allows you to modify your project plan on-the-fly. Whether you need to extend a task’s timeline or compress it to meet deadlines, resizing and dragging offer real-time adjustments.
6. Filter
Gantt charts often include filtering capabilities that allow you to focus on specific aspects of your project. For example, you can filter tasks by team member, task type, or priority level. This feature streamlines your view of the project, making it easier to manage and track specific subsets of tasks.
7. Time Frame or Date Range
Specify the time frame or date range displayed in your Gantt chart to effectively zoom in on specific periods within your project. Consequently, adjusting the time frame helps you concentrate on short-term or long-term planning, depending on your current project management needs.
8. Customize the Display of the Timeline
Customization options for the timeline display are crucial for tailoring the Gantt chart to your specific preferences. You can meticulously customize aspects such as task bar colors, labels, legends, and additional visual cues. This meticulous customization ensures that your Gantt chart not only serves as a functional project management tool but also provides a visually intuitive and appealing representation of your project plan.
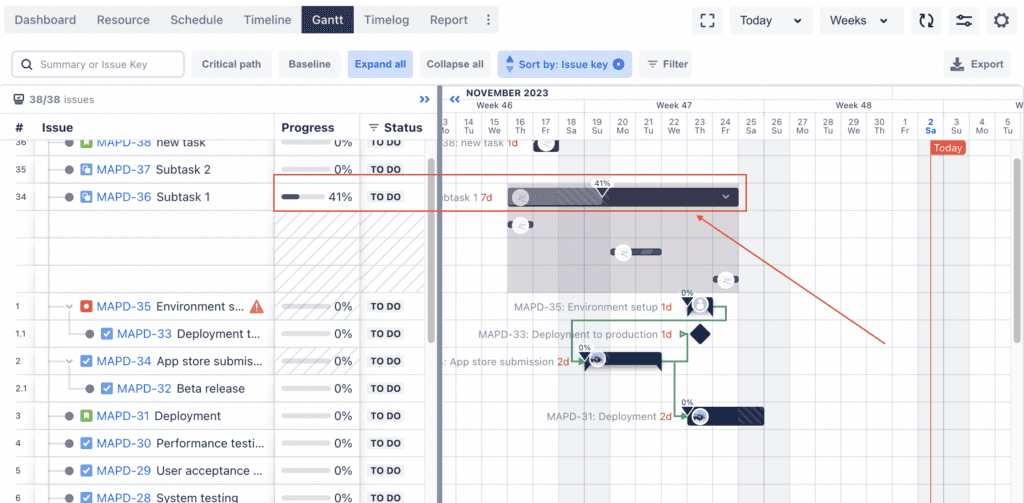
See Project Progress – Step 5
- Slide on the Bar: In the Gantt chart, slide task bars to visually edit progress in real-time.
- Edit in Issues Table: Alternatively, manage and update progress in the ‘Issues table’ view, where you can quickly and efficiently edit task statuses and details. This method offers a straightforward and expedient way to keep track of project developments.
Issues table View – Step 6
The ‘Issues table view’ is a powerful feature that provides an Excel-like spreadsheet interface for efficiently managing project issues and tasks within your Gantt chart. This view not only effectively combines the simplicity of a spreadsheet with the capabilities of Jira but also offers a flexible and intuitive way to organize, edit, and track project issues, thereby enhancing overall project management efficiency. Consequently, here’s how to make the most of it:
- Excel-Like Interface: The Issues table view resembles a spreadsheet, making it familiar and user-friendly for those accustomed to working with spreadsheets.
- Efficient Issue Management: Within this view, you can access a comprehensive list of all project issues and tasks, including details such as task names, assignees, due dates, and progress percentages.
- Inline Editing: Easily edit issue details directly within the table. Consequently, this inline editing feature allows you to swiftly update task statuses, descriptions, priorities, and other relevant information. As a result, it streamlines the process of maintaining up-to-date and accurate project data, ensuring efficient project management.
- Customizable Columns: Customize the columns displayed in the table to focus on the specific information that matters most to your project. Accordingly, tailor the view to your preferences by selecting the columns that provide the most valuable insights, ensuring a streamlined and efficient way to monitor and manage critical aspects of your project
ect…
Use Case: Agile Software Development Project
Imagine you are managing an agile software development project for a mobile application. Your team diligently follows the Scrum methodology to deliver iterative updates and improvements. In this specific context, you can strategically leverage JIRA with the ProScheduler plugin to effectively and efficiently manage and visualize your project using Gantt charts, optimizing both management and visualization aspects of your project.
Task Assignment
You open the ProScheduler tool within JIRA and select the “Gantt” tab to access the Gantt chart functionality. Upon doing so, the default “WBS Gantt” is immediately enabled, effectively mirroring the project’s initial hierarchy in the timeline.
Dependencies
Using the Gantt chart, you set up task dependencies. For instance, coding cannot start until the design phase is complete. These dependencies are crucial to maintaining a logical sequence of work.
Baseline and Critical Path
You establish a baseline to capture the project’s initial plan and identify the critical path, which includes tasks critical to the app’s release. By doing so, you effectively set a standard for measuring project progress and prioritize tasks that are essential for a timely and successful launch.
Progress Monitoring
As sprints progress, you slide the progress bars on the Gantt chart to reflect completed user stories and tasks. You can also edit progress directly in the Issues table view.
Adjustments
Agile projects often encounter changes, such as new feature requests or bug fixes. You use the Gantt chart’s flexibility to adjust task durations and dependencies to accommodate these changes.
Team Collaboration
Your development team collaborates seamlessly using the Issues table view. In this space, they can swiftly edit task statuses, and furthermore, add comments and update details. Consequently, this setup encourages effective and timely communication, significantly enhancing project tracking and team coordination.
Customization
You can customize the Gantt chart’s display, strategically color-coding tasks to differentiate between development, testing, and deployment phases. This approach not only enhances visual clarity but also aids in effectively managing the various stages of your project.
Real-Time Insights
The Gantt chart provides real-time insights into project progress, thereby enabling you to make informed and strategic decisions regarding resource allocation and sprint planning. Consequently, these insights are crucial for the success of your project, as they allow for a more targeted and effective approach in managing resources and timelines. As a result, this tool becomes indispensable in navigating the complexities of project management, ensuring a cohesive and efficient workflow.
In the fast-paced world of project management, having the right tools can make all the difference. Consequently, in this blog, we’ve explored how JIRA, combined with the ProScheduler plugin and Gantt charts, empowers project managers and teams to effectively streamline their project planning, tracking, and visualization.
Key Takeaways:
- Visual Efficiency: Gantt charts provide an intuitive visual timeline for precise project planning.
- Real-Time Flexibility: Easily adapt to changes by adjusting tasks, timelines, and tracking progress in real time.
- Resource Management: Efficiently assign and plan resources for smoother workflows.
- Baseline and Critical Path: Monitor changes and identify critical tasks for on-time milestones.
- Issues Table: Simplify task management with a spreadsheet-like interface for easy updates and collaboration.
- Customization: Tailor the Gantt chart to match your project’s unique needs and your team’s preferences.
- Agile Compatibility: Whether you follow agile or traditional project management, JIRA and ProScheduler adapt to your workflow.
With JIRA and ProScheduler’s Gantt charts, you can significantly enhance your project management, gain substantial transparency, and consequently boost efficiency. Therefore, embrace these tools to dramatically increase your chances of delivering successful projects on time and well within scope. Ultimately, here’s to your future project management success!