Difference between Gantt Chart vs Pert Chart
To wrap up projects on time and within budget, project managers require efficient planning and management tools. For that purpose, both Gnatt and Pert charts come in handy.
But what is Gantt Chart vs Pert Chart? Many people ask us this question – especially given that some project management software offers both and uses both words interchangeably. But they are quite different, and knowing the difference will be important to you.
Without further ado, let’s delve into the Gantt chart vs Pert chart comparison;
Gantt Chart vs Pert Chart: What are They?
A Gantt Chart and a PERT Chart are project management tools that create a graphical representation of a project’s schedule.
Historically, Gantt charts have been used to visualize the progress of projects.
What are Gantt Charts
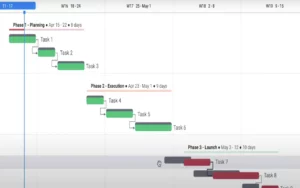
Gantt charts are introduced by Henry Gantt to show tasks, their durations, and milestones over time. This makes it easier for team members to understand what they must do, when, and how much time they will need to complete the task. It also helps you identify where you’re falling behind so that you can take necessary actions such as rescheduling or adding more resources.
What is a GANTT chart used for?
A Gantt chart is a visual project management tool that helps in planning and scheduling projects of all sizes. It’s essentially a horizontal bar chart that shows project tasks against a timeline. Here’s what a Gantt chart is used for:
- Scheduling: It lays out the start and end dates of individual tasks within a project, helping to plan the overall project timeline.
- Tracking Progress: You can see at a glance which tasks have been completed, which are in progress, and which are yet to start, making it easy to monitor the progress of the project.
- Resource Management: By showing which tasks are being worked on and by whom, it helps in managing the allocation of resources effectively.
- Visualizing Task Dependencies: Some tasks can’t start until others are finished. Gantt charts make these dependencies clear, helping to coordinate tasks that depend on each other.
- Communicating with Team Members: It serves as a communication tool, providing team members with visibility into the project schedule, their tasks, and deadlines.
In summary, a Gantt chart is a practical tool for project planning and tracking, offering a clear visual timeline for tasks and facilitating better project management and communication.
What are Pert Charts
Pert stands for “Program Evaluation Review Technique.” A Pert chart is similar to a Gantt chart in that it shows the start and finish dates of a project, task, or activity. However, Pert charts can also show how long each task will take (duration), as well as how soon it must begin (earliest start) and end (latest finish).
What is a PERT chart used for?
A PERT chart is a tool used in project management to plan and schedule tasks. It helps in organizing and visualizing the steps needed to complete a project, especially when task durations are uncertain. Here’s what a PERT chart does in a nutshell:
- Outlines Tasks: Shows all tasks in a project and how they link together.
- Estimates Time: Uses three estimates (optimistic, pessimistic, and most likely) to predict how long tasks will take.
- Finds the Critical Path: Identifies the longest path of tasks that determines the project’s duration.
- Helps with Planning: Aids in allocating resources, monitoring progress, and adjusting schedules.
In short, a PERT chart is useful for managing complex projects, improving time estimates, and ensuring that projects are completed on time.
In Pert charts, there are three types of events
- Critical path
- Optimistic path
- Most likely path (also known as an expected path)
Pert Chart vs Gantt Chart: How to Choose?
When choosing between the Gantt chart vs pert chart, consider these factors:
Project Scope
You’ll want to choose the right chart based on your needs and what you’re trying to accomplish with your project management software (or spreadsheet). If you manage an important or large-scale project, then Gantt Charts will help you visualize the number of resources each task requires at any given time during your project’s duration (or how long each phase will take).
Timeline
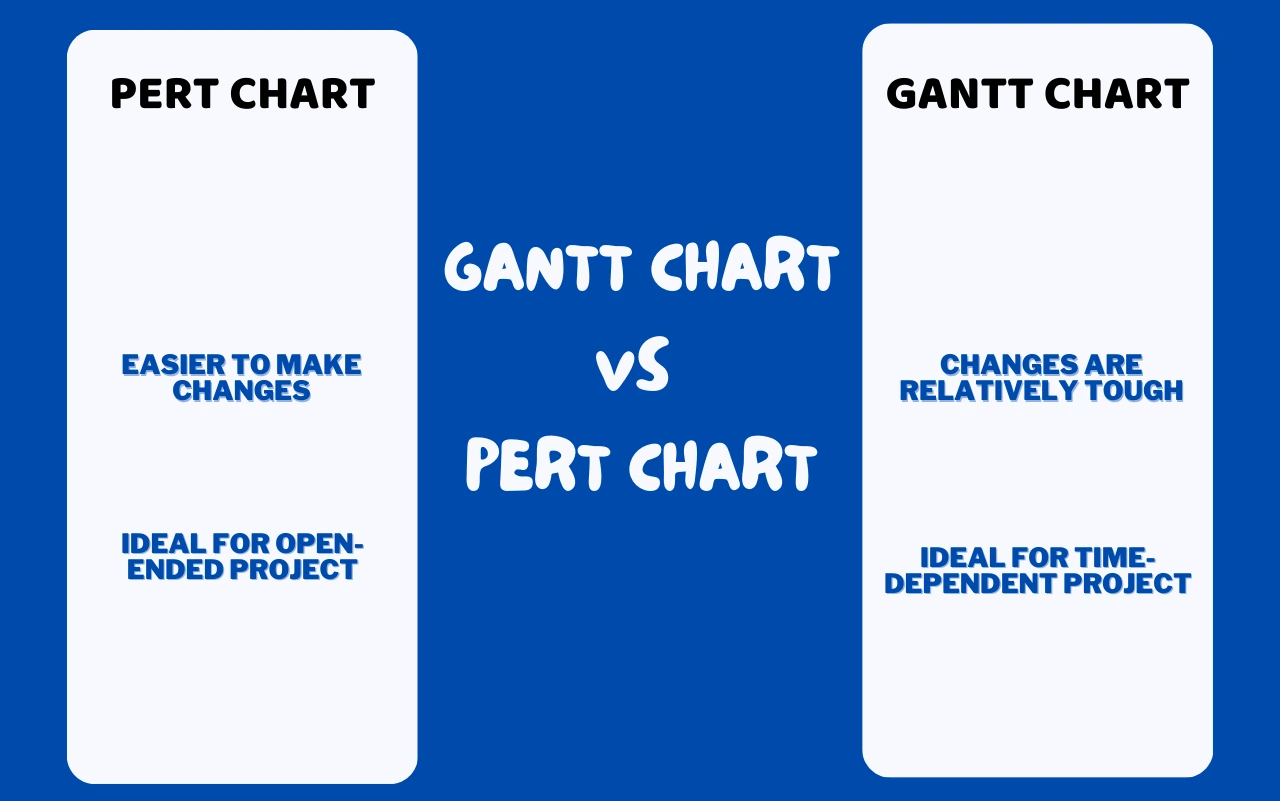
Gantt charts are great for keeping track of time-sensitive projects, like construction or event planning. PERT charts are more appropriate for projects without a fixed completion date and that may include unknown variables..
Flexibility
You can easily change PERT charts to accommodate changing circumstances. They are effective in situations where the project lacks a deadline and allows for necessary modifications. Gantt charts are also flexible, but they require more work from you to make changes as problems arise or new tasks arise.
Task Assignment
You can use a PERT for any project or task involving multiple people and dependencies among those tasks. A Gantt suits smaller projects without many people or dependencies better.
Pert vs Gantt: Which one is best?
You make tough decisions as a project manager. Which project management software should you use? How do you choose between Pert and Gantt charts? What’s the best way to manage your projects?
The answer to that question is dependent on your needs and project type.
Gantt and Pert are two of the most popular types of bar charts. Both can be used for scheduling and planning projects. Gantt charts are typically more popular than Pert charts because they are easier to use and understand. However, Pert charts can give you more details about each task, which may be important if you need to do a lot of calculations with your schedule.
Key Differences Between Gantt Chart and Pert Chart
Gantt charts and Pert charts are two different types of project management charts. Both of these charts have a lot of similarities, but they also have some differences. Here are the key differences of Gantt Chart and Pert Chart:
Task duration vs task start date
In a Gantt chart, you can see the duration of each task in days, weeks, or months. On the other hand, in a Pert chart, you can see the start date for each task.
Task dependencies vs path length
In Pert charts, you can see the path length, which shows how much time it takes to complete all tasks from beginning to end. On the other hand, in Gantt charts, you can see task dependencies, which show how much time it takes to complete one task after another (e.g., A must finish before B).
Multiple tasks per node vs one task per node
In both charts, there is only one node per row or column. This means we place multiple tasks under one node instead of creating multiple nodes for each task, similar to how we use Excel’s AutoFilter feature or pivot tables. That’s why our project management software includes built-in filters.
Final Words
Both the Gantt chart and the Pert chart are project management tools that display task schedules on charts. The charts plot interrelated tasks over a defined period and then break up the tasks with the aid of bars or lines extending from a central task to a peripheral one. Both project management tools have pros and cons, and it is important to choose the right one as per your requirements.
If you want to learn more about project management software, ProScheduler is the best solution available.
FAQs
What is Different Between Gantt Chart vs Pert Chart vs CPM?
The Gantt Chart, Pert Chart, and Critical Path Method (CPM) are three scheduling tools that can help you schedule project activities. Their usage and the information they provide can vary based on the project and tool you’re employing.
Are bar graphs Pert or Gantt?
A bar graph can be either Pert or Gantt. It depends on the way you set up your bar graph.
- It’s a Pert chart if you use a bar graph to show the completion date of a project.
- When a bar graph represents a project’s projected completion date, it’s a Gantt chart.
What is better than a Gantt chart?
Here are some alternatives to Gantt charts that will help you manage work and increase project success:
- Lists.
- Whiteboards.
- Mind maps (or project network diagrams)
- Scrum boards.
- Documents.
- Dashboards
- Kanban boards.
- Timelines.
Can a PERT Chart change during a project?
Tasks completed sooner or later than expected, the addition of new tasks, or changes in dependencies often cause changes in a PERT chart during a project. Regular updates are necessary to reflect the current state of the project.
Is a PERT Chart suitable for all projects?
PERT charts are particularly useful for large and complex projects with uncertain task durations. For smaller projects with well-defined tasks and timelines, a Gantt chart might be more appropriate.