As software development continues to evolve in 2026, work breakdown structures (WBS) remain one of the most reliable tools for planning complex projects. A WBS breaks a project into smaller, manageable components so teams can plan better, assign work clearly, and track progress more confidently.
When a WBS is visualized as a timeline, it becomes a software project Gantt chart. This combination is still considered one of the most widely used ways to plan and schedule projects because it helps estimate duration, understand resource needs, and decide the order in which tasks should be completed.
In this article, we’ll walk through three WBS Gantt chart examples tailored for software development projects in 2026, then look at how they come to life inside Jira using a visualization tool like TeamBoard ProScheduler.
3 Gantt Chart Examples for Software Development Projects
In this section, we’ll look at three common project scenarios and how their WBS could be structured:
- Web application development
- Mobile application development
- Software product development
Each example is written in a way that can be translated directly into a software project Gantt view, where every high-level item becomes a summary task and each sub-item a detailed task on the timeline.
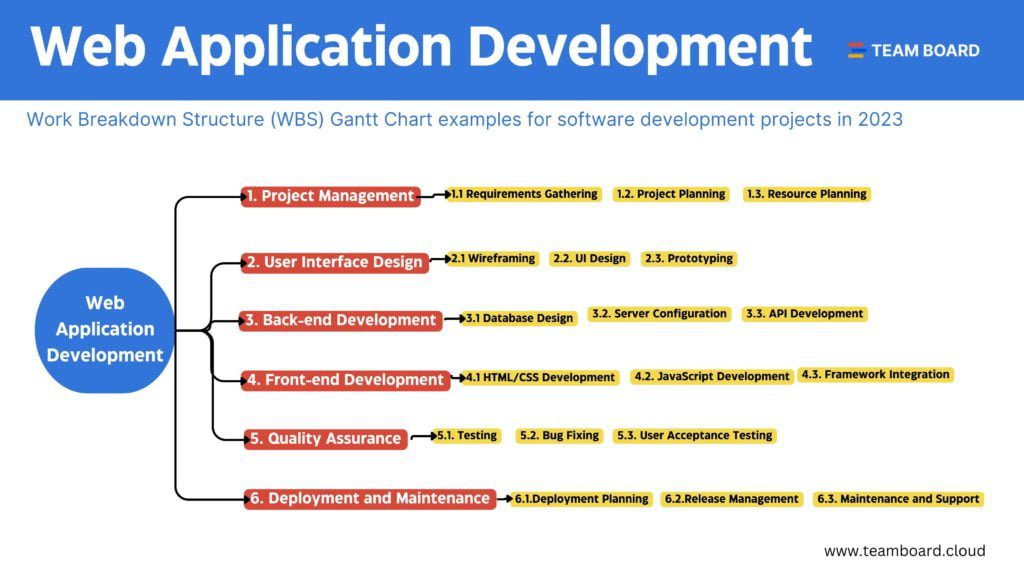
Example 1: Web Application Development
This first example focuses on a typical web application, such as a customer portal or internal dashboard. At the WBS level, the work is broken down as follows:
- Project Management
- Requirements Gathering
- Project Planning
- Resource Planning
- User Interface Design
- Wireframing
- UI Design
- Prototyping
- Back-end Development
- Database Design
- Server Configuration
- API Development
- Front-end Development
- HTML/CSS Development
- JavaScript Development
- Framework Integration
- Quality Assurance
- Testing
- Bug Fixing
- User Acceptance Testing
- Deployment and Maintenance
- Deployment Planning
- Release Management
- Maintenance and Support
In a software project Gantt chart, these elements are placed on a timeline. For example, “Requirements Gathering” and “Project Planning” would appear early, with “Back-end Development” and “Front-end Development” overlapping where it makes sense. “Quality Assurance” then follows, with “Deployment and Maintenance” closing the project.
This view helps you see whether you’re overloading the team at any point, which tasks can run in parallel, and how delays in one area (like API Development) will affect others (such as Front-end integration).
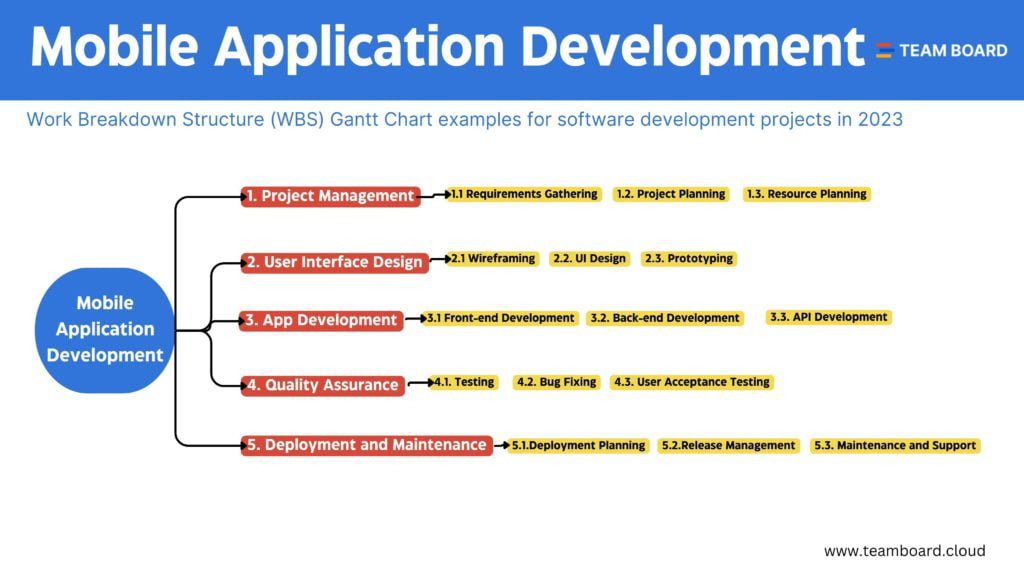
Example 2: Mobile Application Development
The second example focuses on a mobile app project. The structure is similar to the web app example but tuned for platform-specific constraints and app store releases.
- Project Management
- Requirements Gathering
- Project Planning
- Resource Planning
- User Interface Design
- Wireframing
- UI Design
- Prototyping
- App Development
- Front-end Development
- Back-end Development
- API Development
- Quality Assurance
- Testing
- Bug Fixing
- User Acceptance Testing
- Deployment and Maintenance
- Deployment Planning
- Release Management
- Maintenance and Support
On a software project Gantt, you’ll typically see extra emphasis on device testing, platform-specific builds, and app store timelines. For example, “Deployment Planning” includes preparing app store listings, screenshots, and release notes, while “Release Management” must align with submission and review times.
By turning this WBS into a Gantt chart, you can visually coordinate development, QA, and release tasks so that code freeze, store submission, and marketing activities all line up.
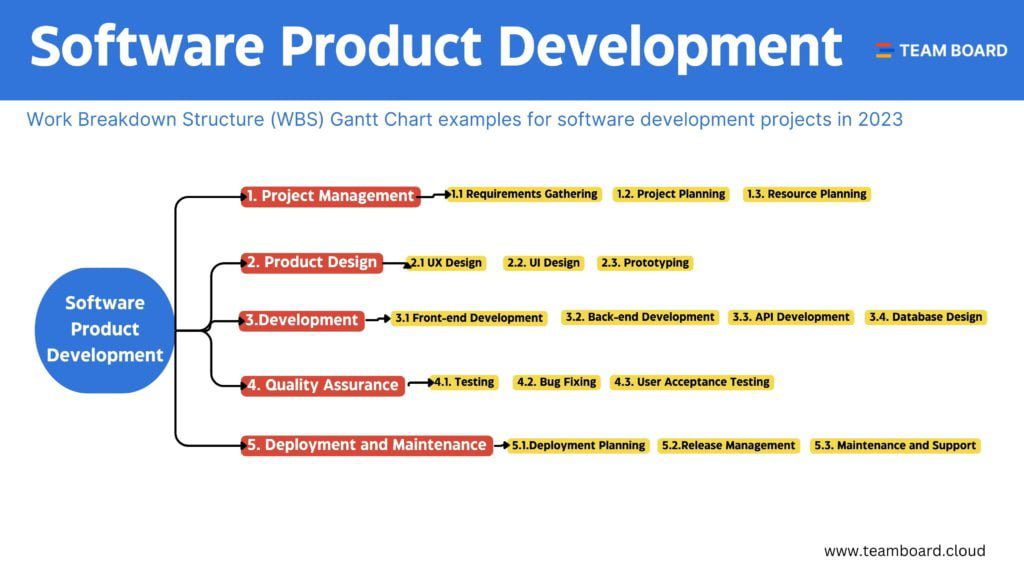
Example 3: Software Product Development
The third example covers broader software product development, such as a SaaS platform or enterprise tool. These projects often involve multiple releases and long-term maintenance, so a clear WBS and software project Gantt chart are especially useful.
- Project Management
- Requirements Gathering
- Project Planning
- Resource Planning
- Product Design
- UX Design
- UI Design
- Prototyping
- Development
- Front-end Development
- Back-end Development
- API Development
- Database Design
- Quality Assurance
- Testing
- Bug Fixing
- User Acceptance Testing
- Deployment and Maintenance
- Deployment Planning
- Release Management
- Maintenance and Support
On the timeline, you might visualize this WBS across multiple iterations or releases. For example, Release 1.0 might include only a subset of features under “Development,” while later releases reuse the same WBS structure for additional modules.
Using a Gantt chart to organize this work helps you see the progression from MVP to later versions, align multiple teams, and clearly communicate when stakeholders can expect major milestones.
Why use a WBS Gantt Chart in Jira
Many teams manage their software projects in Jira, which continues to be one of the most widely used tools for project management and issue tracking among development teams. Recent surveys show that a majority of professional developers still rely on Jira for project management, task tracking, and collaboration.
In that environment, a WBS Gantt chart becomes even more powerful because it builds directly on issues and epics you already use every day.
By using TeamBoard ProScheduler, you can create and manage WBS-based Gantt charts from within Jira. ProScheduler is now positioned as an all-in-one solution for project and portfolio management in Jira, combining WBS Gantt charts, resource planning, time tracking, and cost management into a single tool.
What does a WBS Gantt Chart for Agile Software Development look like on TeamBoard?
On TeamBoard, the Gantt chart looks like a traditional one:
- A timeline along the top
- Tasks, epics, or issues listed on the left
- Bars showing the start and end dates of each item
- Visual links that represent dependencies between tasks
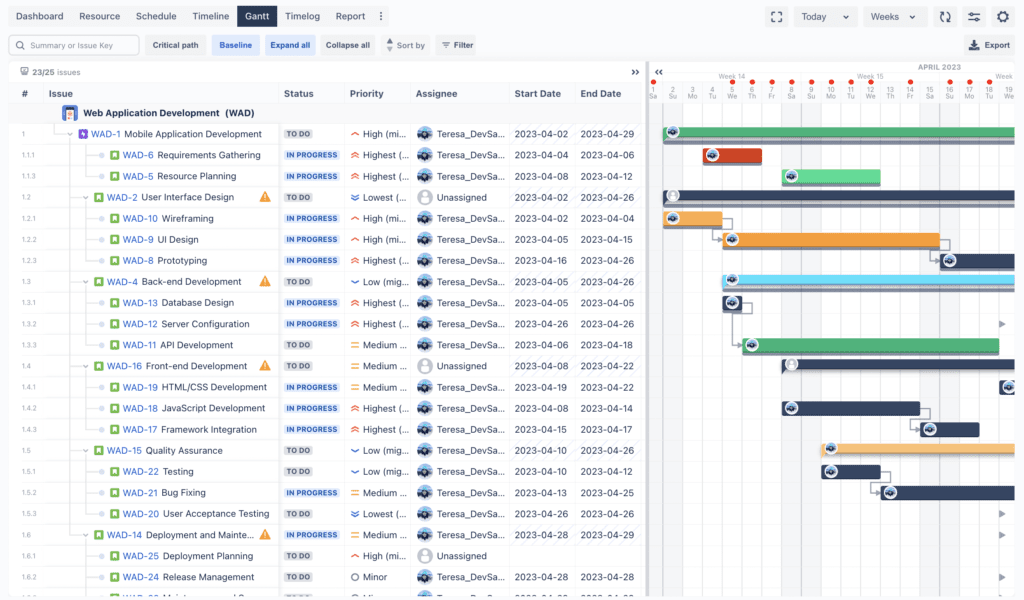
To create a Gantt chart in TeamBoard, you typically start by creating or selecting a project in Jira, then switching to the “Gantt” view. From there, you can add or adjust tasks directly from the chart, assign team members, set start and end dates, and add dependencies so that changes to one task automatically update related items.
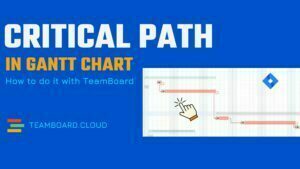
Recent enhancements in ProScheduler include advanced features like critical path analysis and baseline tracking. These features give teams more insight into schedule risk and allow them to compare current progress against the original plan—capabilities that are particularly valuable for software projects with tight deadlines and multiple dependencies.
TeamBoard’s Gantt view also offers useful customization options. You can change colors to highlight critical tasks, zoom the time scale in or out (days, weeks, months), and filter tasks by assignee, status, or issue type. Drag-and-drop updates make it easy to reschedule work as priorities shift, which fits well with Agile environments where plans evolve frequently.
Overall, a WBS Gantt chart built with TeamBoard gives you a live, visual software project Gantt chart that stays in sync with your Jira data. You get the structure of a WBS, the timing of a Gantt, and the flexibility to support Agile, waterfall, or hybrid methods.
Wrapping Up
A well-structured Work Breakdown Structure, combined with a clear Gantt chart, is one of the most effective ways to plan and track software development projects in 2026.
The three examples in this article — web application development, mobile app development, and software product development — show how you can turn a simple WBS into a detailed software project Gantt chart that your team can follow with confidence.
With tools like TeamBoard ProScheduler for Jira, you can take these structures and bring them to life: visual timelines, dependencies, WBS hierarchies, and real-time updates, all sitting on top of the work your team is already managing.
Whether you’re working in Agile, waterfall, or a mix of both, using a WBS-based Gantt chart helps you stay organized, communicate clearly, and deliver software projects more predictably.