Gantt charts, with their visually intuitive timelines and task relationships, have revolutionized how project progress is tracked and communicated. From small startups to large enterprises, the versatility of Gantt charts makes them indispensable for clear visualization of project timelines and dependencies.

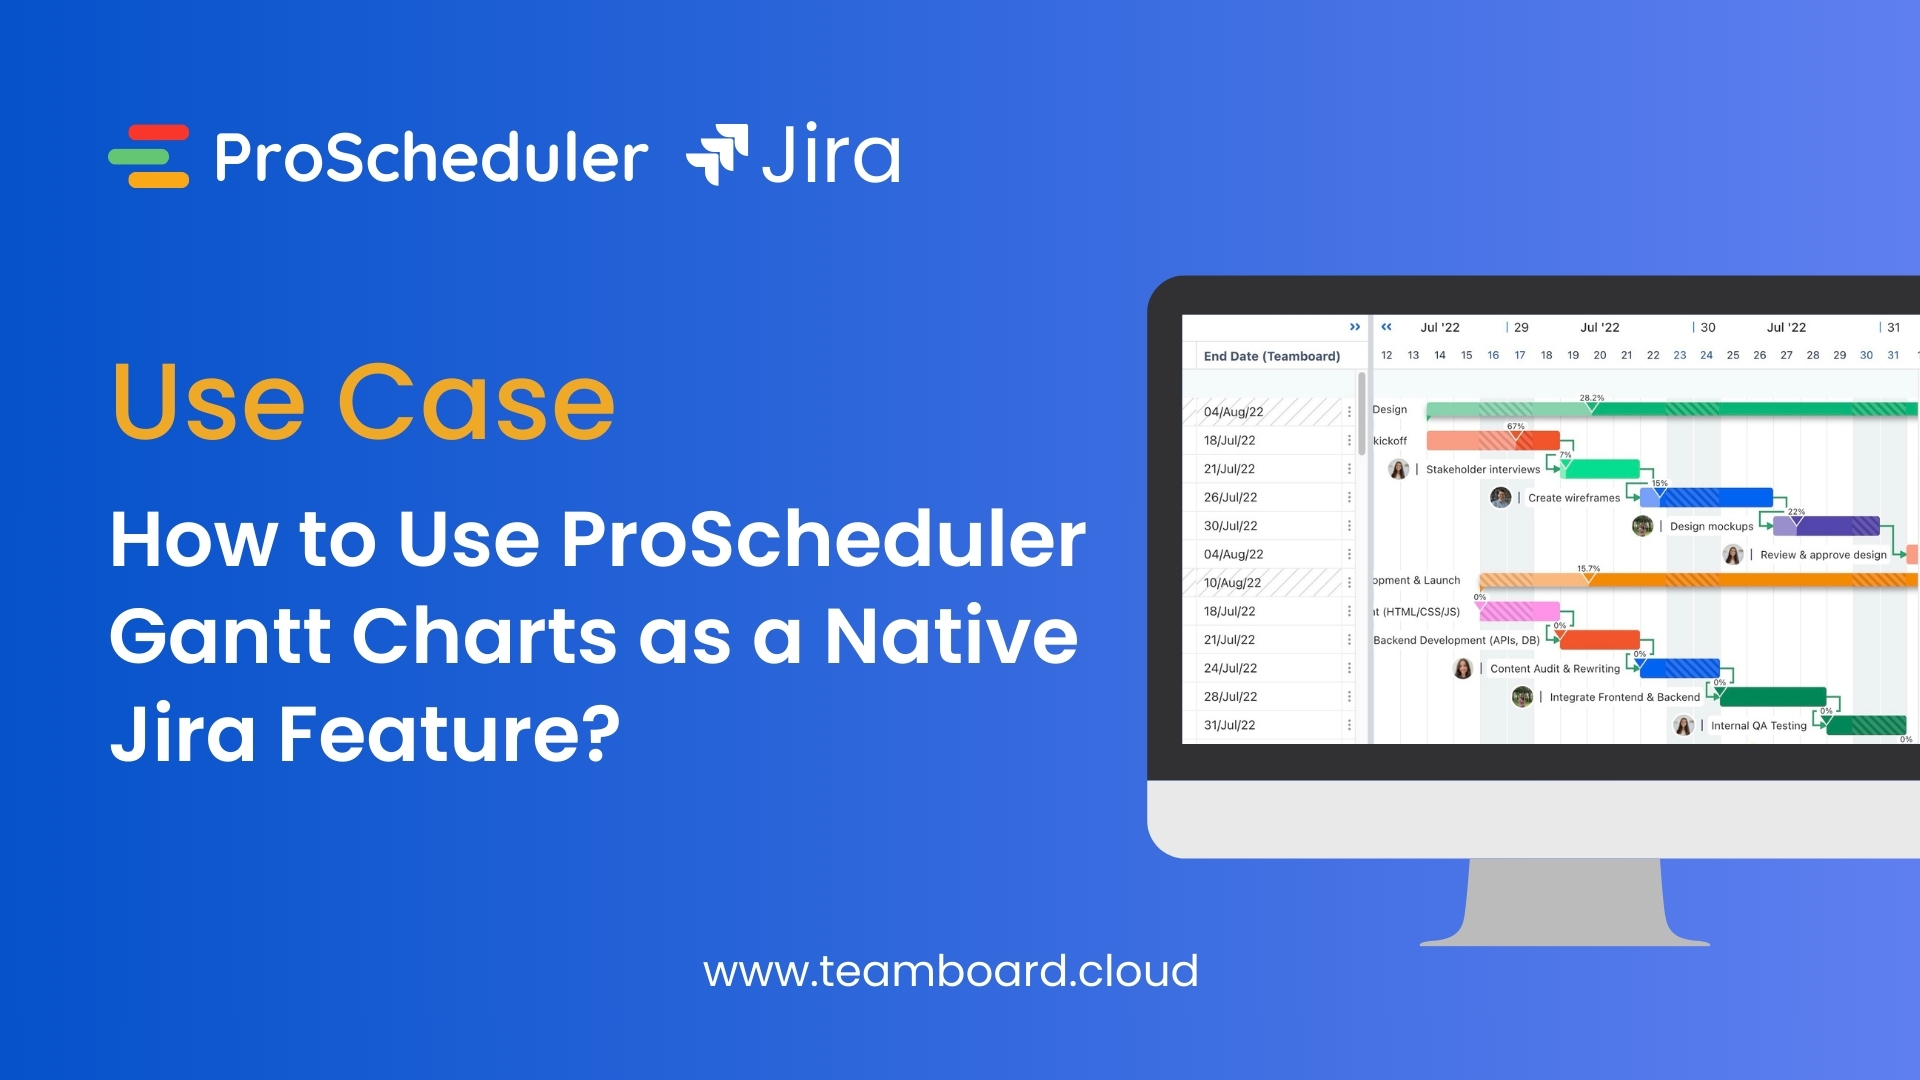
In this blog, we dive deep into the art and science of crafting the perfect Gantt chart within the Jira ecosystem. Whether you’re a seasoned Jira user or just starting out, our practical tips and insights aim to enhance your project management skills. From setting up your first chart to mastering advanced features, this guide is your companion in navigating the world of Gantt charts in Jira. So, let’s embark on this journey to streamline your project management process, ensuring no task is left behind and every deadline is met with precision.
Crafting the Perfect Gantt Chart in Jira
1. What is a Gantt Chart?
In the realm of project management, the Gantt chart is more than just a tool; it’s a visual storytelling medium that allows project managers to encapsulate complex project timelines and tasks in an easily digestible format. To fully appreciate the power of Gantt charts in Jira, it’s important to understand what they are and why they’re so crucial in managing projects effectively.
Definition and History
- A Gantt chart, named after its inventor, Henry Gantt, is a type of bar chart that represents a project schedule.
- It was developed in the 1910s and has since evolved into a fundamental project management tool.
- The chart displays tasks or activities against time, with each task represented by a bar; the position and length of the bar reflect the start date, duration, and end date of the task.
Key Components
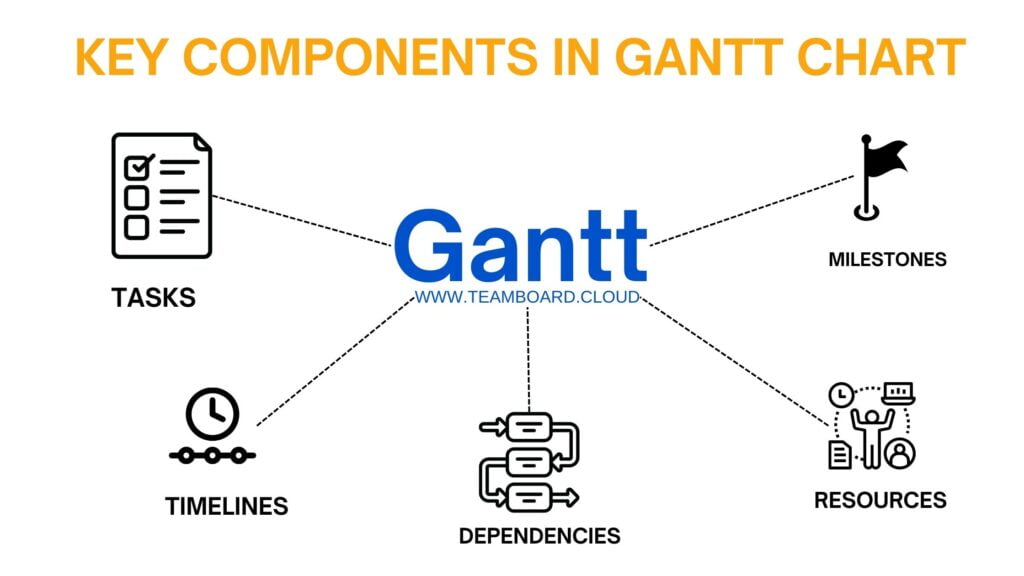
- Tasks: The building blocks of a Gantt chart, tasks represent individual pieces of work or milestones in a project.
- Timelines: These horizontal lines or bars indicate the duration of each task and how they overlap or run consecutively.
- Dependencies: Illustrated by connecting lines or arrows, dependencies show how tasks are linked to each other and the sequence in which they need to be completed.
- Milestones: Represented by distinct markers, milestones signify major events or goals in the project timeline.
- Resources: Details about who is responsible for each task and the resources allocated can also be included.
Benefits of Gantt Charts
- Clarity and Visibility: By providing a visual representation of tasks and timelines, Gantt charts offer a clear understanding of the project scope and progress.
- Improved Planning: They enable project managers to plan the order of tasks, identify overlapping activities, and allocate resources efficiently.
- Enhanced Communication: Gantt charts serve as a straightforward communication tool for stakeholders to grasp the project timeline and status quickly.
- Track Progress: They allow for real-time tracking of project progress against the planned schedule, highlighting delays or ahead-of-schedule tasks.
- Flexibility: Gantt charts can be easily adjusted as projects evolve, making them ideal for dynamic project environments.
Advanced Gantt Chart Features in Jira
After grasping the basics of creating a Gantt chart in Jira, it’s time to delve into the more advanced features that can take your project management skills to the next level. Jira offers a range of functionalities that can add depth and complexity to your Gantt charts, making them even more powerful tools for managing large-scale and intricate projects.
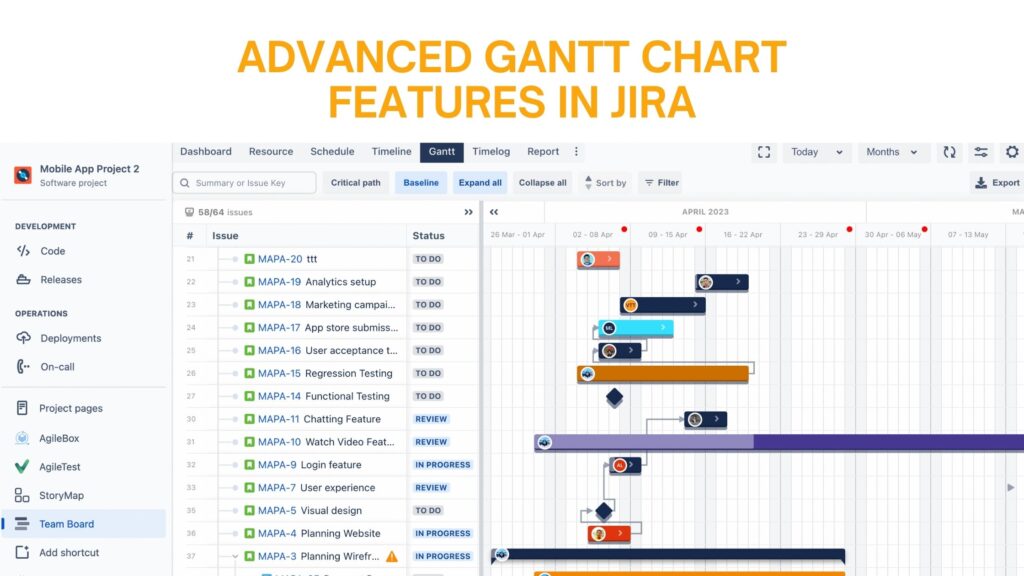 Exploring Advanced Features and Functionalities
Dependencies and Critical Path Identification:
- Jira allows you to establish and visualize dependencies between tasks, a crucial aspect of any project’s success.
- You can identify the critical path in your project – the sequence of tasks that directly impacts the project’s completion date.
- Understanding and managing these dependencies ensures that delays in one task do not negatively cascade through your entire project.
Resource Allocation and Workload Management:
- Advanced Gantt charts in Jira let you allocate resources to specific tasks and manage the overall workload of your team.
- This feature helps in identifying over-allocated resources, ensuring a balanced distribution of work among team members.
- Effective resource management is key to preventing burnout and maintaining high productivity levels.
Customization for Clarity and Visual Appeal:
- Jira provides options to customize your Gantt charts in terms of colors, labels, and layout.
- These customizations not only enhance the visual appeal but also aid in better understanding and differentiation of tasks and milestones.
- A well-customized Gantt chart can convey a wealth of information at a glance, making it a potent communication tool.
Integrating Gantt Charts with Other Jira Features and Plugins
When managing complex projects in Jira, utilizing plugins like TeamBoard ProScheduler can significantly enhance the functionality and effectiveness of your Gantt charts. Let’s explore how adding more baseline, critical paths, and progress fields through this plugin can elevate your project management experience.
1. Extending Baseline Functionality
- Setting Multiple Baselines: TeamBoard ProScheduler allows you to set multiple baselines, which are essential for tracking and comparing the original project plan against its actual progress.
- Benefits of Multiple Baselines: This feature helps in understanding how changes and delays affect your project over time, providing a historical view of your project’s evolution.
2. Advanced Critical Path Analysis
- Identifying Critical Paths: The plugin enhances critical path identification, which is crucial for pinpointing tasks that directly affect your project’s finish date.
- Dynamic Critical Path Visualization: With ProScheduler, critical paths are not just static elements; they dynamically update based on task progress and changes, giving you a real-time view of your project’s most sensitive areas.
3. Progress Field Tracking
- Real-Time Progress Monitoring: You can track the progress of each task and the overall project through intuitive progress fields.
- Visual Indicators: The plugin provides visual indicators, such as progress bars integrated within Gantt chart tasks, offering a clear and immediate overview of task completion levels.
By leveraging these additional features of the TeamBoard ProScheduler plugin, your Gantt charts in Jira become an even more powerful tool. They not only help in meticulous planning and tracking but also provide critical insights and facilitate better decision-making throughout the project lifecycle.
Tips for Crafting the Perfect Gantt Chart in Jira
Crafting the perfect Gantt chart in Jira requires a blend of strategic planning, careful execution, and continuous refinement. Here are some key tips to help you create and manage an effective Gantt chart:
1. Start with Clear Objectives
Define the scope and objectives of your project clearly before setting up your Gantt chart. This clarity will guide the structuring of tasks and milestones.
2. Break Down Tasks
Decompose large tasks into smaller, manageable sub-tasks. This makes it easier to track progress and identify potential bottlenecks early on.
3. Establish Realistic Timelines:
Set achievable timelines for each task, considering potential delays and dependencies. Be realistic in your planning to avoid overcommitting resources.
4. Utilize Dependencies:
Properly map out dependencies between tasks. Understanding which tasks are sequential and which are parallel helps in effective scheduling and avoids resource conflicts.
5. Set Milestones:
Identify and highlight key milestones in your project. Milestones are crucial checkpoints that help assess progress and realign goals if necessary.
6. Regularly Update Your Chart:
A Gantt chart is a dynamic tool. Regularly update it to reflect the current status of tasks, any changes in deadlines, or adjustments in resource allocation.
7. Use Color Coding and Labels:
Make your Gantt chart easy to read by using color coding and labels. This visual aid is particularly helpful when dealing with complex projects with multiple overlapping tasks.
8. Track Progress Accurately:
Use the progress tracking features in Jira to monitor how far along tasks are. This helps in quickly identifying tasks that are off-track.
9. Leverage Jira’s Advanced Features:
Make the most of Jira’s functionalities like baselines, critical paths, and custom fields. Plugins like TeamBoard ProScheduler can enhance these capabilities further.
Communicate with Your Team:
Keep your team informed about the Gantt chart updates. Regular communication ensures everyone is aligned and aware of their responsibilities and deadlines.
Review and Reflect:
Periodically review the Gantt chart with your team to gather feedback and make necessary adjustments. This reflection is vital for continuous improvement.
Balance Flexibility and Structure:
While it’s important to stick to the plan, be flexible enough to accommodate necessary changes. Agile project management principles can be integrated into your Gantt chart for this purpose.
By following these tips, you can craft a Gantt chart in Jira that is not only visually appealing but also a practical and effective tool for managing your projects with precision and efficiency.
About TeamBoard ProSccheduler
TeamBoard ProScheduler is an advanced Jira plugin designed to optimize project management. It boasts features like comprehensive visibility across various project timelines, an intuitive drag-and-drop interface for easy scheduling, and the ability to categorize resources into distinct teams or departments. Additionally, it offers powerful reporting tools with interactive and customizable options and enhances Jira’s Gantt chart and timeline functionalities for improved project planning and tracking. These capabilities collectively enhance the efficiency of managing projects, programs, and portfolios in Jira.