Welcome to the world of enhanced project management! If you’re a project manager, team leader, or anyone involved in planning and tracking projects, you’re likely familiar with the challenge of keeping everything organized and on schedule. This is where a Gantt chart, a powerful tool in the project manager’s toolkit, comes into play.
In this blog, we’re going to explore how you can easily create a simple yet effective Gantt chart using Google Sheet, and Microsoft Excel and seamlessly integrate it with Jira, a popular project management software. This combination offers the flexibility of Excel with the powerful tracking capabilities of Jira, streamlining your project management process significantly.
Getting Started with the Free Excel Gantt Chart in Jira Template
Embarking on the journey of effective project management begins with the right tools, and our Free Excel Gantt Chart Template is a prime starting point. This template is designed to simplify the process of creating a Gantt chart, making it accessible to both beginners and experienced professionals. Here’s how to get started:
Step 1: Access the Template
Find the Template:
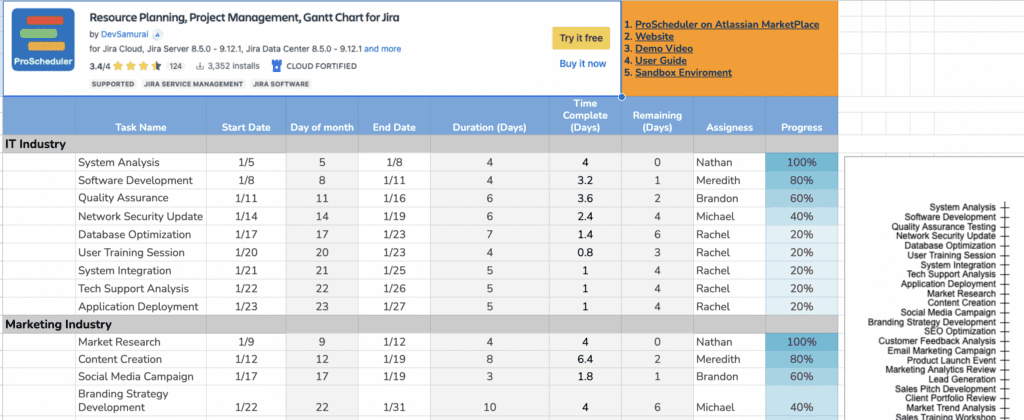
- Access the enhanced IT Industry Gantt Chart Template by clicking here. This link directs you to the CSV file that I’ve created based on your requirements.
- Click File => Make a copy
Step 2: Familiarize Yourself with the Template
1. Explore the Layout:
- Once the file is open in Google Sheets, you’ll see a series of columns typically including ‘Task Name’, ‘Start Date’, ‘End Date’, and ‘Duration’.
- This layout represents the basic structure of a Gantt chart where each row corresponds to a specific task or a sub-task within your project.
- The ‘Start Date’ and ‘End Date’ columns are crucial as they will define the timeline of each task on the Gantt chart.
Consider how you might want to customize the template to better suit your project’s needs. This could involve adding new columns (like task dependencies, status, or assigned team members), changing the format of the dates, or even adjusting the visual style of the chart.
Step 3: Import to Jira
Once you have familiarized yourself with the Gantt chart template in Excel and customized it as per your project requirements, the next step is to download the template as a CSV file and import it into Jira. This process allows you to integrate your project planning with Jira’s robust project management tools. Here’s how you can do it:
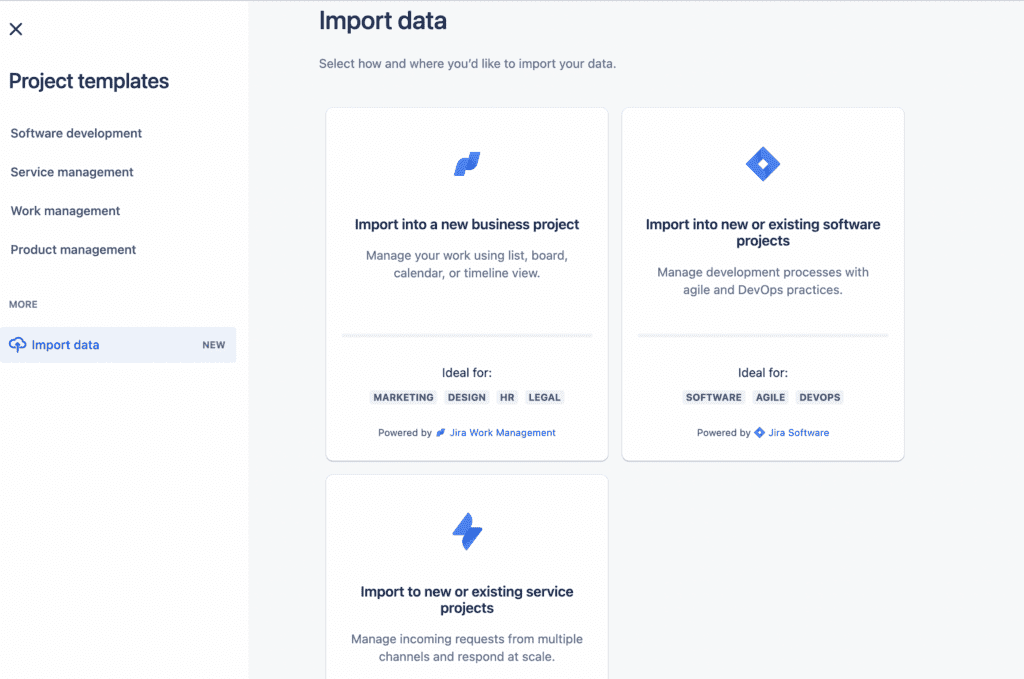
- From the navigation bar, select Projects > Create project.
- From the sidebar, go to More > select Import data.
- In the Import from CSV section, upload the CSV file that you want to import. For best results, make sure your CSV file is properly prepared and structured. More about preparing and structuring your CSV file
- After uploading the file, preview and map the column data to fields for how you want it to appear in the business project. We’ll create an issue in your new Jira Work Management project for each row of data. More about mapping data
- If you want a field type specific to fit your team’s needs, select Map to a field and then Create a new custom field. More about custom fields
- Once you’ve mapped the data in the preview table, you’ll be prompted to set up a new Jira Work Management business project to finish the import. More about creating a business project
- After the project has been set up, we’ll automatically start importing the data in the background and use a progress bar to indicate the status of your import. As data is imported it will show on the board view as issues in your new project. More about the board view
Step 4: Customize the Template for Your Project
After importing your Gantt chart data into Jira, the next crucial step is to customize the template according to your project’s specific needs.
1. Install TeamBoard ProScheduler:
- Navigate to the ‘Apps’ section in your Jira instance.
- Search for and install the TeamBoard ProScheduler app. This tool enhances Jira’s capabilities, allowing for more comprehensive Gantt chart management directly within the platform.

2. Input Project Data:
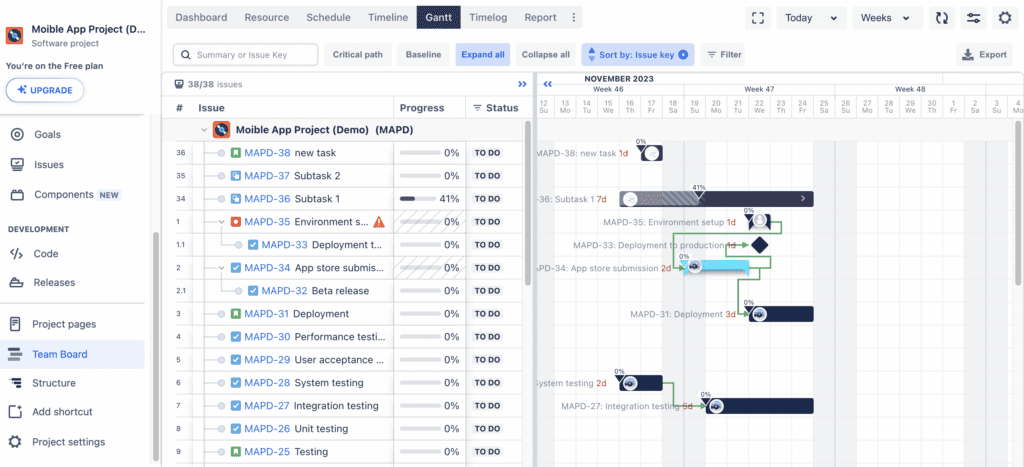
- Open the TeamBoard ProScheduler app within Jira.
- Navigate to the Gantt chart feature.
- When it is accessed for the first time the current hierarchy in TimeLine overview and Jira. will be copied and assigned the Work-Breakdown-Structure (WBS) number accordingly.
- You will see issue table detail and Gantt View.
3. Define Durations and Dependencies:
- The TeamBoard ProScheduler should automatically calculate task durations based on the start and end dates.
- If your project includes dependent tasks (where one task relies on the completion of another), set them up in the app to reflect these relationships.
Step 5: Utilize Advanced Features
Once your Gantt chart is set up and customized in the TeamBoard ProScheduler within Jira, it’s time to leverage its advanced features to manage your project more effectively. These features not only enhance the functionality of your Gantt chart but also provide deeper insights into your project’s progress and challenges. Here’s how you can make the most out of these advanced features:
1. Enhanced Customization
- Continue to refine the visual appearance of your Gantt chart in TeamBoard ProScheduler. Use different colors and styles to represent various types of tasks, phases, or priorities, making the chart more intuitive and informative.
2. Conditional Formatting
- Apply conditional formatting rules to highlight critical tasks, overdue tasks, or other important elements. This feature can automatically change the color or style of tasks based on specific conditions, such as deadlines approaching or tasks falling behind schedule.
3. Progress Tracking
- Regularly update the progress of each task in your Gantt chart. If your template includes a feature for progress tracking, make sure it accurately reflects the current status of your tasks. This real-time update is crucial for maintaining an accurate project timeline.
4. Managing Dependencies
- Clearly define and manage task dependencies within your Gantt chart. Understanding the interconnections of tasks helps you anticipate potential delays and plan accordingly.
5. Setting up Baselines
- Utilize the baseline feature to set and compare original project plans against actual progress. This can be crucial for tracking deviations and understanding the impact of changes in your project.
6. Marking Milestones
- Identify and mark key milestones within your Gantt chart. Milestones signify important goals or checkpoints in your project and serve as valuable markers for tracking overall progress.
7. Custom Issue Table Detail
Take advantage of the ability to customize issue details in your Gantt chart. This may include adding specific fields or data points that are relevant to your project, providing a more comprehensive view of each task.
Note: These advanced features are designed to enhance your project management capabilities. Regularly exploring and experimenting with these functionalities can lead to more effective and efficient project execution.
- 3 Work Breakdown Structure (WBS) Gantt Chart examples for software development projects in 2023
- What is Work Breakdown Structure (WBS) Gantt Chart
- WBS Gantt Chart in Jira using TeamBoard ProScheduler | Step-by-Step Guide #3
- WBS Gantt Chart in Jira for Project/ Portfolio Management
- Tips for Crafting the Perfect Gantt Chart in Jira
Our guide on creating a Gantt Chart Excel and integrating it with Jira has illustrated a practical and efficient approach to project management. With the free template and Jira’s capabilities, enhanced by TeamBoard ProScheduler, this method simplifies complex project tracking and planning. When you apply these tools, you equip yourself well to navigate your project’s demands with greater clarity and control, leading to more successful outcomes.