There are some apps turn Jira issues list into a spreadsheet and allow users to work on them with Excel-like actions.
Teamboard ProScheduler also has that feature on the Gantt Timeline.
Let’s explore more about how it works.
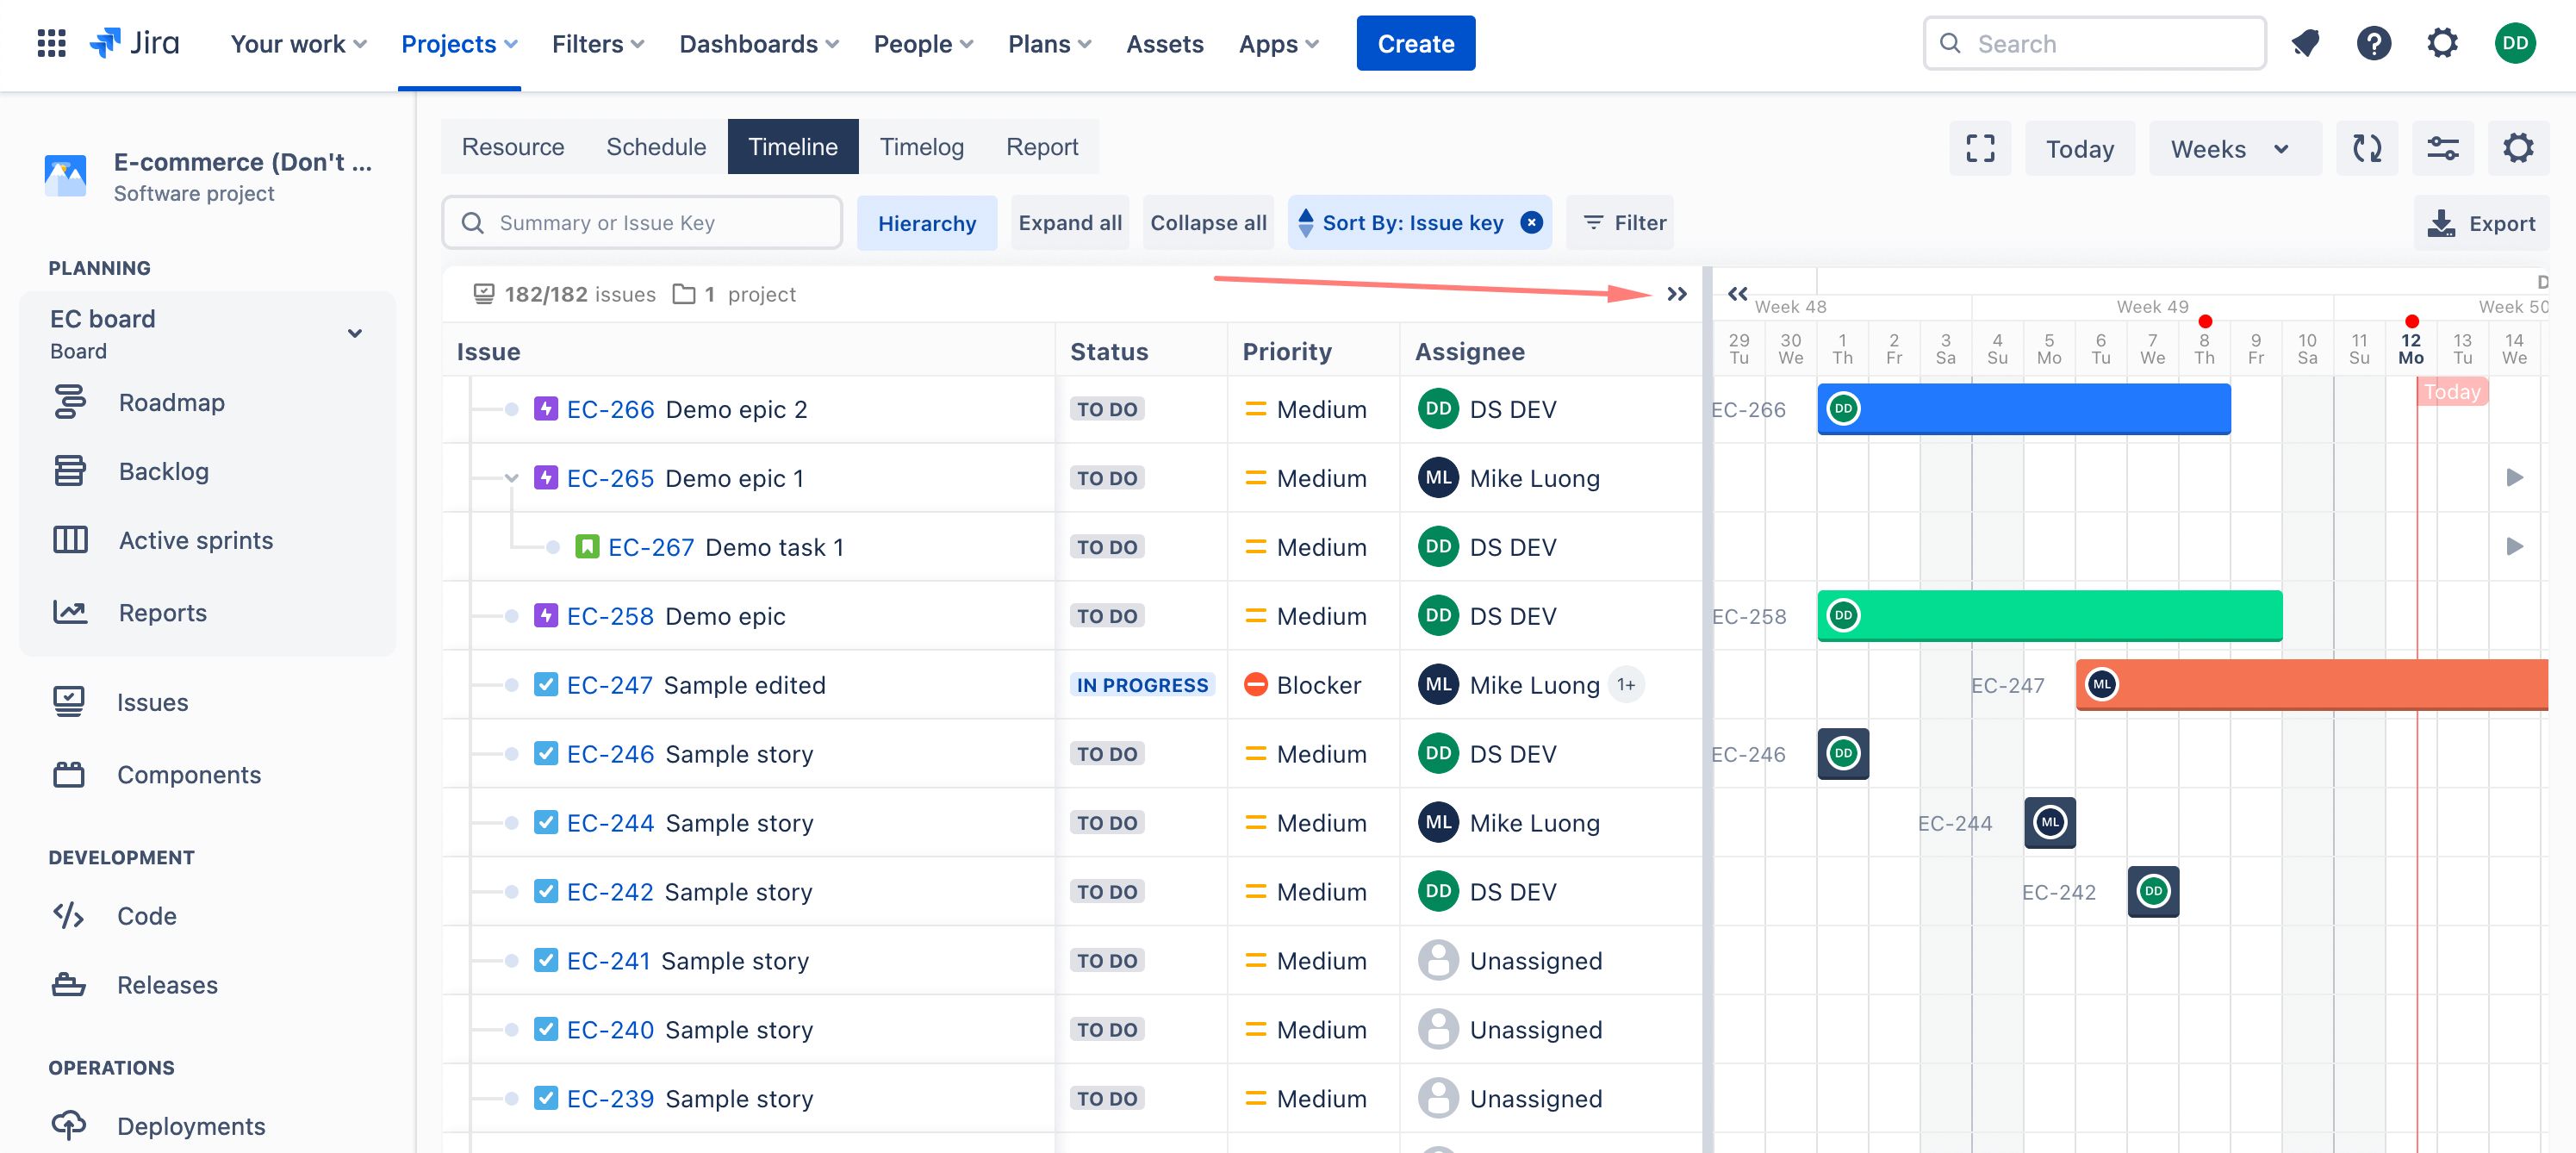
From the Gantt Timeline screen, expand the Issue Table area to the full page, you can also open it on fullscreen
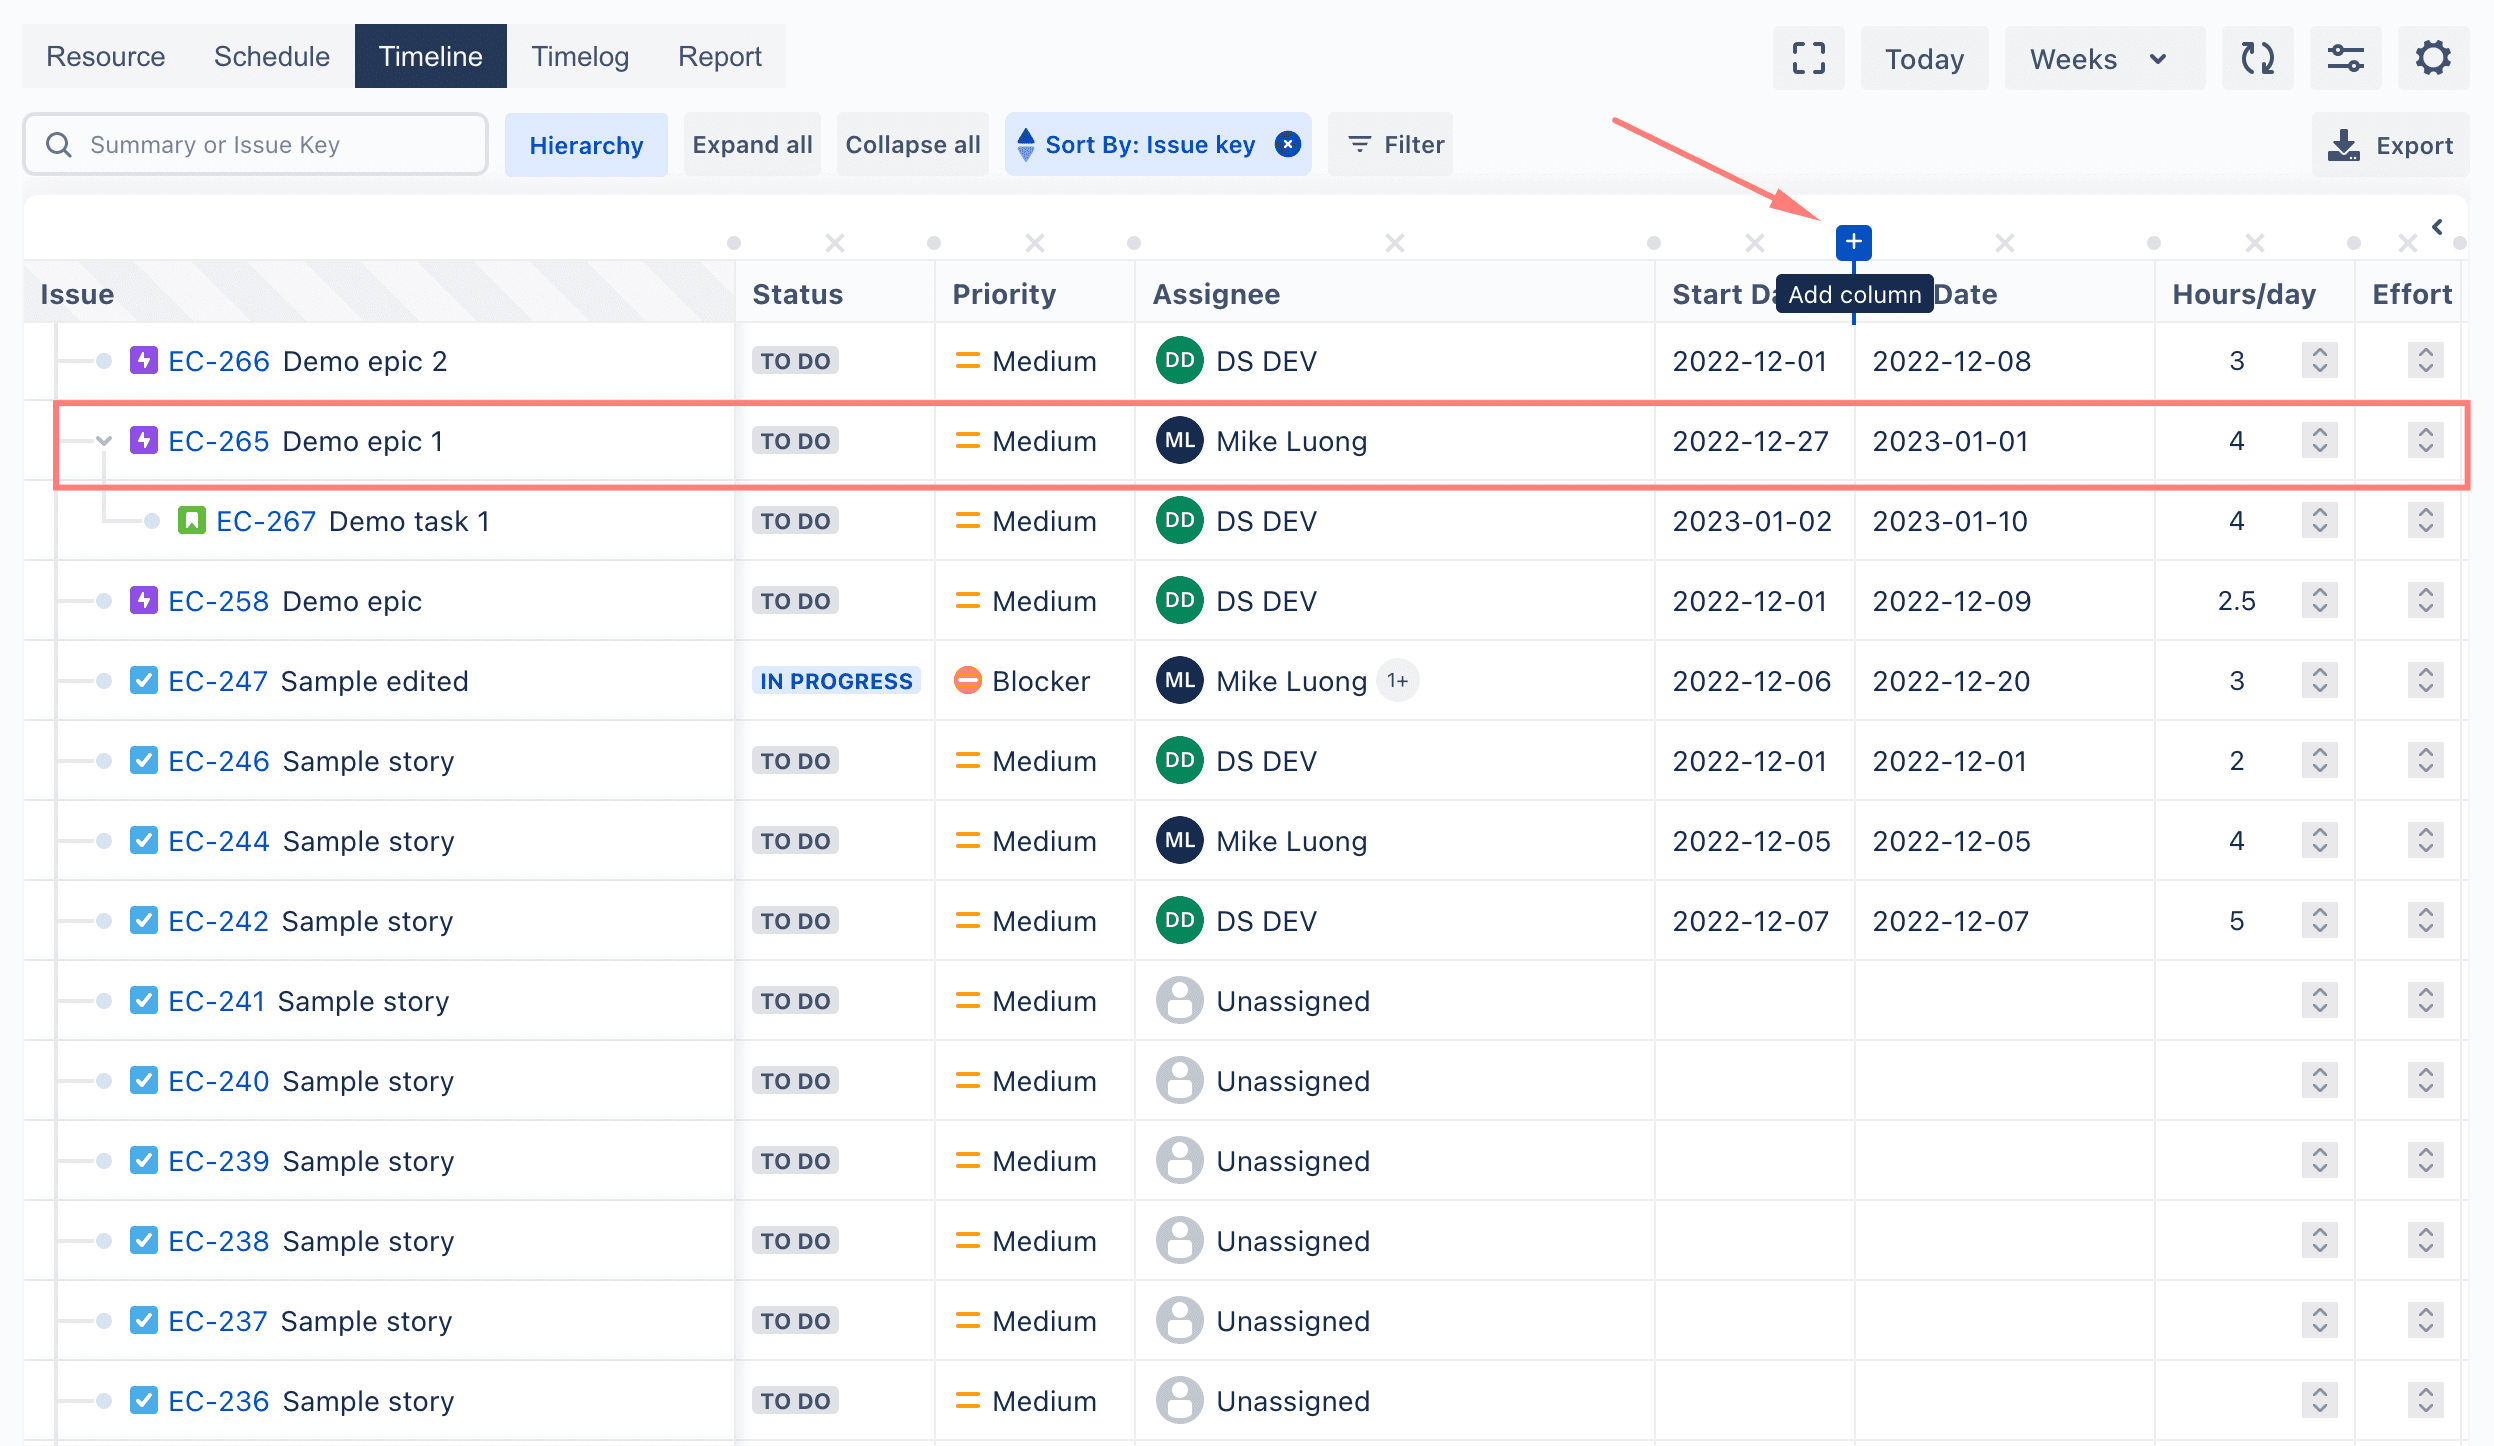
When working within the spreadsheet-like interface, you have a variety of capabilities at your disposal that are designed to optimize your workflow.
- Inline Editing: You can directly edit issue details within the spreadsheet, similar to how you would in Excel. This feature allows for quicker, seamless changes without having to navigate through multiple pages or tabs.
- Sort and Filter: Efficiently manage your data by sorting and filtering issues based on parameters of your choice. This feature allows you to quickly find and organize your tasks according to priority, due date, assignee, status, and more.
- Column Manipulation: The interface allows you to freely move columns around to suit your viewing preferences. Plus, the “freeze column” option ensures that certain key data remains visible no matter how far you scroll.
- Customization of Columns: Add or remove columns based on the data you want to see. This gives you control over what information is immediately visible on your spreadsheet.
- Comprehensive Field Support: The spreadsheet interface supports almost all Jira system fields as well as custom fields. This allows you to work with a wide variety of data points for each issue, from standard fields like “Status” and “Assignee,” to custom fields specific to your project or organization.
- Export Issues: The ability to export issues means you can work on them offline or share them with team members who don’t have access to Jira. This feature offers flexibility and ensures everyone stays on the same page.
- and more
These features and more contribute to an effective and efficient management system. Do watch our demo video for a more comprehensive understanding of these functionalities.