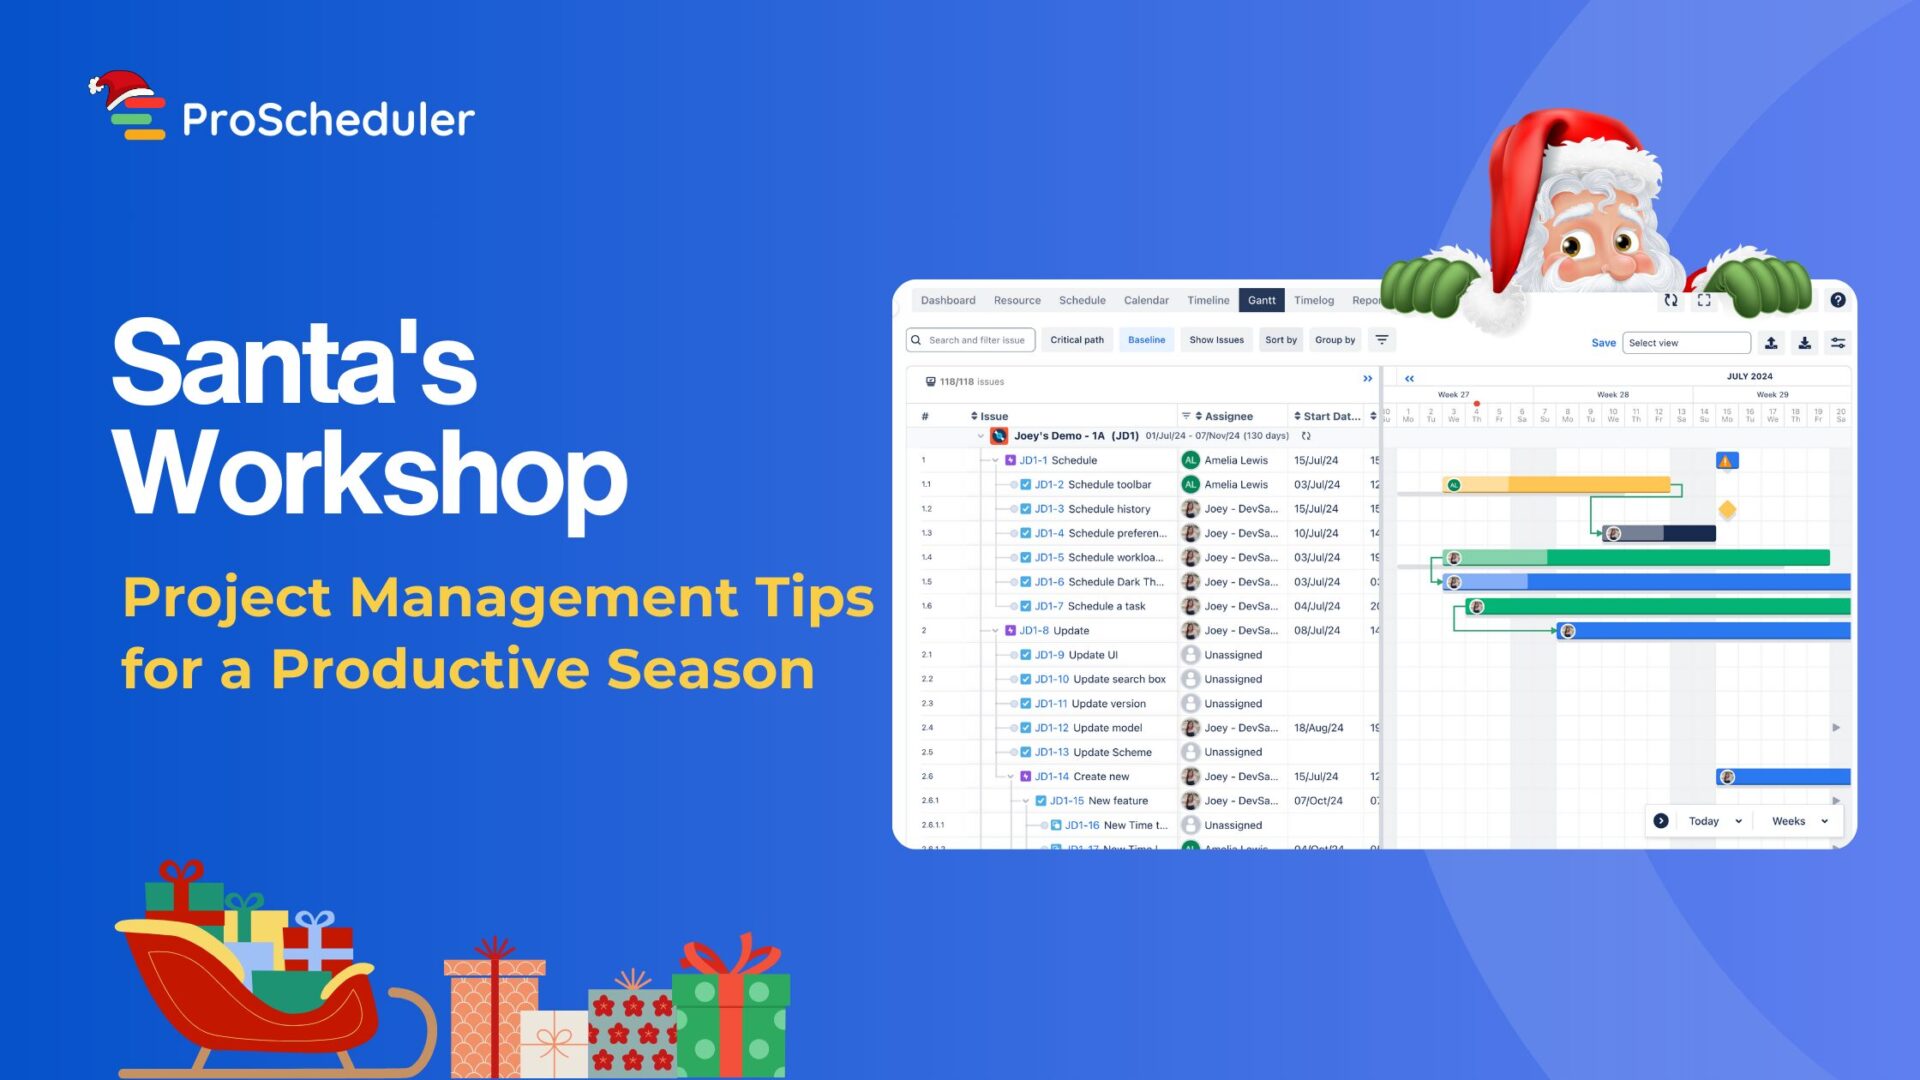
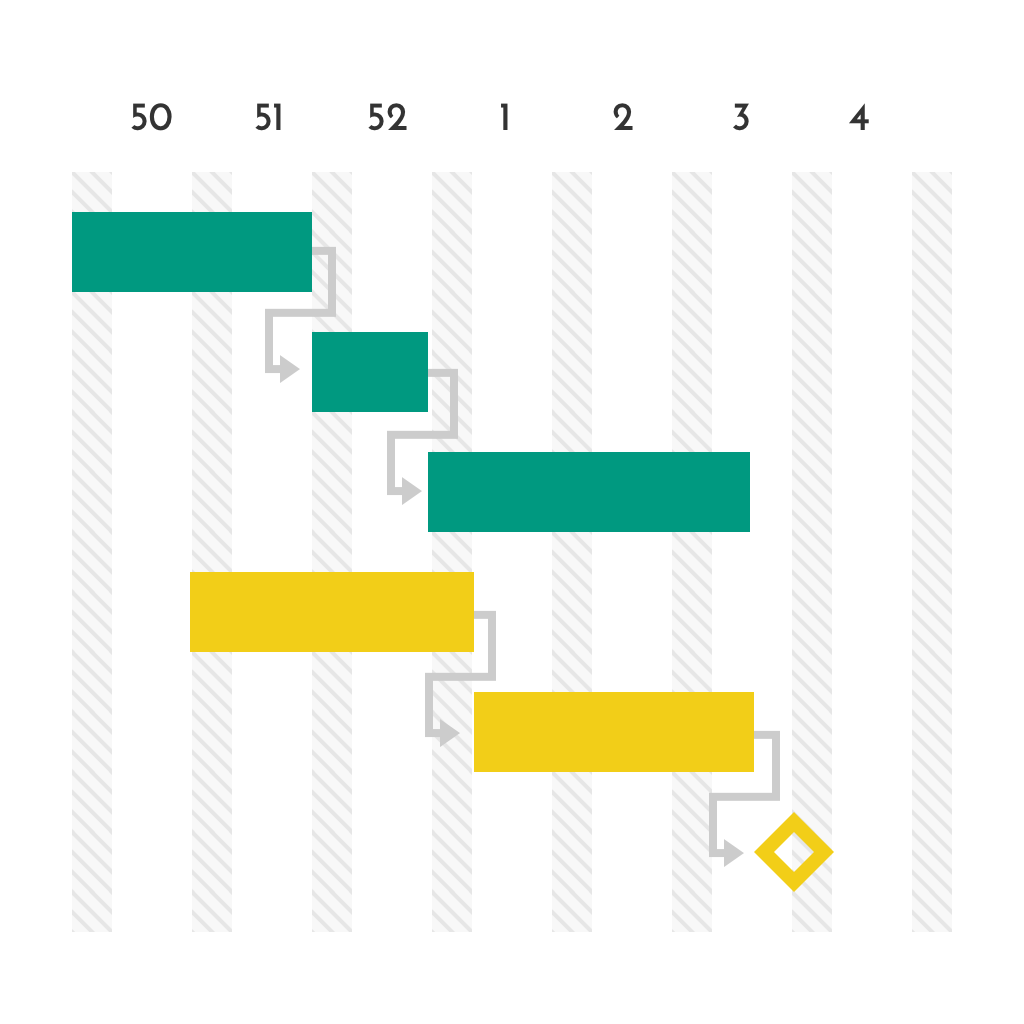
Gantt charts are pretty popular in the business world. A Gantt chart is a visual representation of the steps involved in a project, and it can be used to identify and assess the total time required for completing a project. It may also show the resource allocation to each step of the project. It is a linear scheduling tool used to illustrate project tasks. A Gantt chart is an essential tool for project management. It illustrates the various tasks of a project and their projected start and finishes dates! A Gantt chart helps display the tasks that have been added to the project, what tasks are being tackled first, how much time each task will take, and when the task has to be completed.
A short history behind the Gantt chart
The Gantt chart is a management tool for arranging tasks in a time-based visual format. The history of a Gantt chart is documented in the early 1900s. Henry Gantt wanted to create an effective and efficient way to visualize work using a bar chart, and he finally made it. He’s also credited with inventing the line chart and the pie chart. He wanted to provide a more visual representation of productivity than traditional bar charts. The chart was originally called the “Process Chart” because it displayed various steps in production or process. The chart is a vital tool to help understand the relationships between multiple tasks. We can use it in different industries, including construction, manufacturing, education, and other industries.
What is a Gantt chart used for?
We can use the Gantt chart to visually display a schedule of events and tasks which need to be completed. The chart organizes the time frame in a logical order to help keep track of project objectives and deadlines. This type of chart is beneficial for seeing how assigned work is completed between time frames, making adjustments accordingly.
- Planning: This particular task management method is used to plan projects better. This system divides tasks into their start date, earliest finish date, latest finish date, and the amount of time it will take to finish the project.
- Scheduling: The Gantt chart is a diagram made of horizontal and vertical lines to illustrate relationships between activities, tasks, and time. We can also use this diagram to schedule a project.
- Forecasting: The key to forecasting is ensuring that the right amount of fixed costs are allocated into future periods. This gives the company a better idea of how much cash will be needed in the foreseeable future.
- Allocating Resources: The Gantt chart is often used to Allocate Resources. The chart highlights the timeframe for the project, the status of each task, and costs associated with each task.
- Developing Action Plans: The Gantt Chart is a tool that we can use to develop an action plan.
- Measuring Progress: We can also use the Gantt chart to measure progress. This kind of chart is drawn in a time-based view, and each bar represents a task.
Which tool would be the appropriate option for your business?
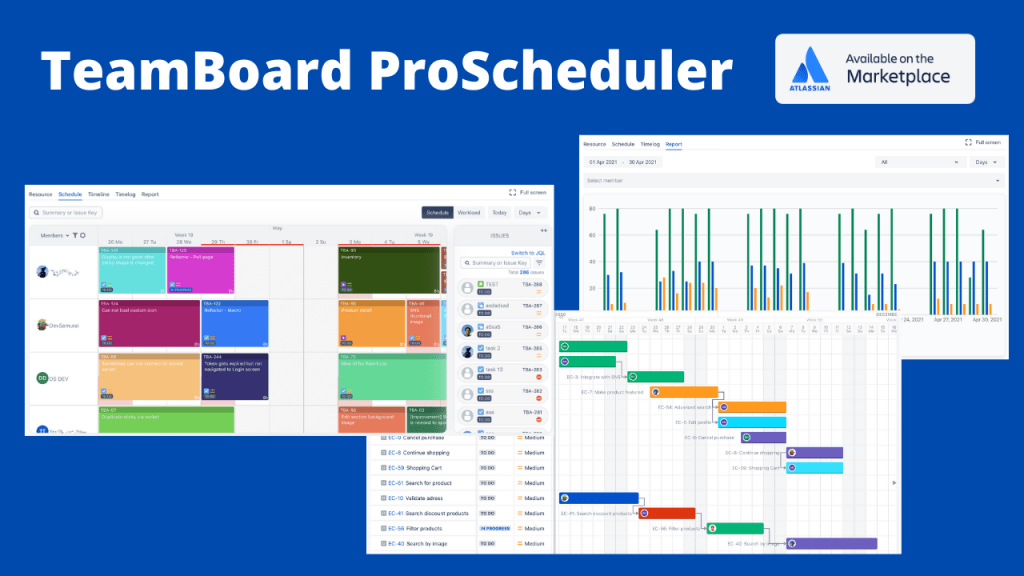
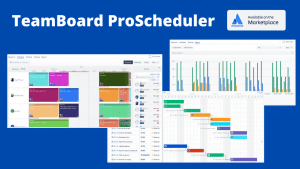
It is always a bit hard to choose the right software for you and your business. There is a bunch of apps available on the internet. Before choosing an app, you must focus on your purpose and the expenses for the software. You don’t want to buy a service that is not worthy for you or not value for the money. DevSamurai has developed an incredible product named ProScheduler: Resource Plan & Gantt for Project Management that is definitely one of the best options for you. Managing and editing Jira issues quickly in the Excel, Spreadsheet-like tabular list view is on another level in it.
Features like milestones, baseline, critical path,auto-scheduling will be added soon. The ProScheduler: Resource Plan & Gantt for Project Management has already satisfied their clients and earned their positive feedback. This modern and user-friendly app will definitely add an extra dimension to your project management system with ease.
Why would you go with TeamBoard’s ProScheduler?
- ProScheduler comes with an excellent user interface, making it more user-friendly than others.
- Super easy installation process.
- It provides drag & drops and resizes cards to plan options to the users.
- Scheduling tasks and assigning to multiple assignees is super easy in ProScheduler.
- Editing and managing Jira issues is as simple as the water in this app.
- Easy time tracking and interactive time reports features are available.
- It provides a FREE app testing option for a team of 10 members and charges a team of 11-15 members as low as 150.00 USD annually.
- Last but not least, friendly after-sale support from us.


