Project managers often deal with complex, multi-step initiatives that can easily become overwhelming if they aren’t broken down properly. Splitting a large project into smaller, manageable chunks helps keep work organized, boosts productivity, and makes it easier to track progress.
To do this effectively, many teams rely on a planning tool called WBS. If you’ve ever wondered what is a WBS in project management or how it actually works in real projects, this guide will walk you through the essentials with practical explanations and work breakdown structure examples.
Prudent planning around dividing and subdividing project goals is crucial for keeping milestones, budgets, deliverables, and resources under control. That’s exactly where WBS comes in.
What is WBS in Project Management?
So, what does WBS stand for? WBS stands for Work Breakdown Structure. It’s a project management tool used to break down a complex or lengthy project into smaller tasks and sub-tasks, arranged in a hierarchical structure.
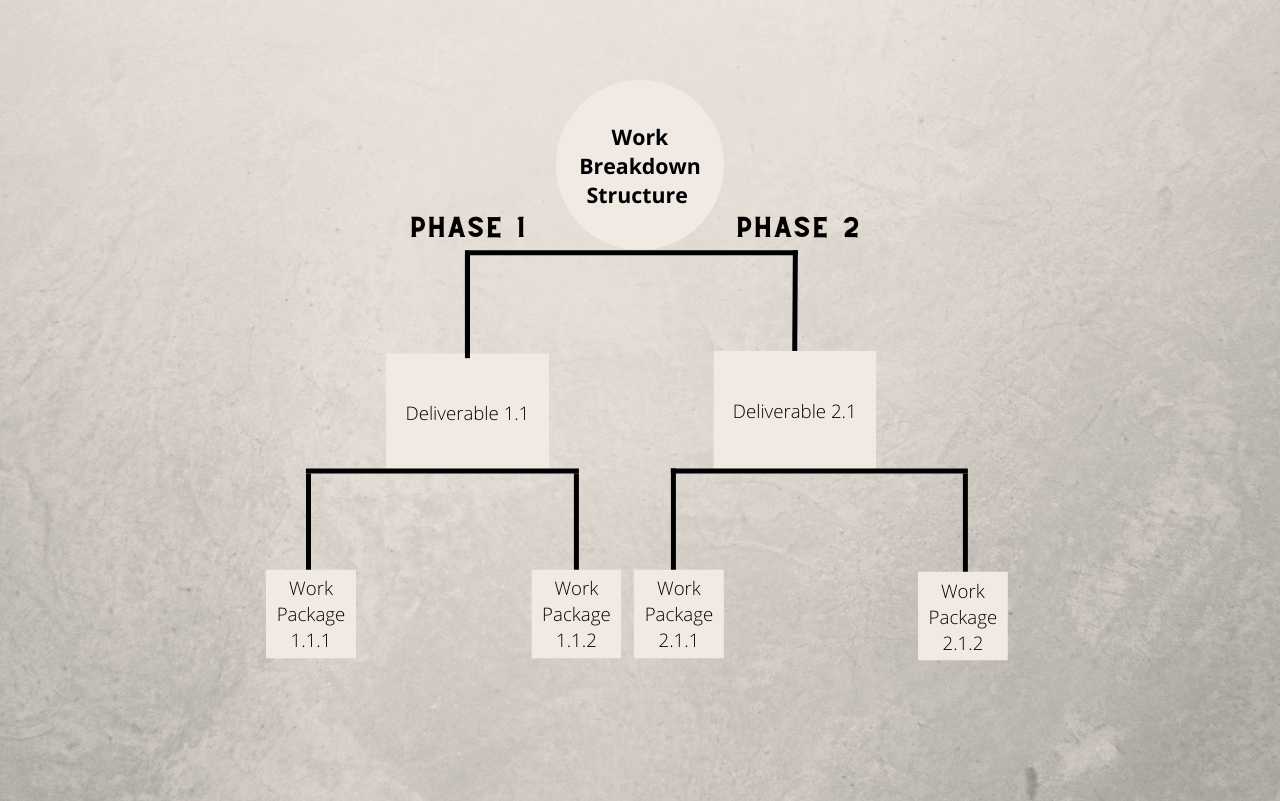
Put simply, a WBS shows your project as a “big picture” at the top level, and then divides it into:
- Major deliverables or phases
- Sub-deliverables
- Work packages and specific tasks
This structure helps project managers and teams:
- Understand the full scope of the project
- See how each part contributes to the final outcome
- Organize and assign work more clearly
So, what is a WBS in project management? It’s a planning and communication tool that visually breaks down all the work needed to complete a project. It aligns the team with the project objectives, clarifies the scope, and provides a step-by-step view of what needs to be done and by whom.
→ Related article: Glossary: Project Management Terms and Definitions from A-Z
Know-How to Construct Work Breakdown Structure
You can build a WBS using different layouts and formats. Some popular work breakdown structure examples include Gantt charts, flowcharts, spreadsheets, or roadmap-style diagrams.
Regardless of the format you use, the process to construct a WBS usually follows a similar sequence:
Define project scope and goals
Start by clearly defining what the project is about and what success looks like.
Clarify:
- The main objective (what you are trying to deliver)
- The boundaries (what’s in scope and what’s not)
- Key constraints (timeline, budget, major risks)
Talk to stakeholders, sponsors, and relevant team members to make sure expectations are aligned. The clearer your scope and goals, the easier it will be to break the project into meaningful chunks later.
List project deliverables
Next, identify the major deliverables or outcomes the project must produce. These might be documents, features, phases, or tangible outputs.
From there:
- Break down each deliverable into smaller components
- Group related work into sections or phases
- Identify work packages – the smallest units of work that can be estimated and assigned
This step is where your WBS begins to take shape as a hierarchy: from high-level deliverables down to detailed tasks that can be tracked in a schedule or tool.
Assign tasks to your team
Once deliverables and tasks have been broken down, assign them to the right people or teams.
Make sure each owner:
- Understands the purpose and expected outcome of their task
- Has the necessary tools, resources, and authority
- Knows how their work connects with other tasks and dependencies
Good WBS usage isn’t just about breaking work down; it’s about making sure every piece of work has a clear owner and is realistically doable within the constraints.
Create a Gantt chart or other templates
After defining and assigning tasks, it’s time to visualize them over time. Many teams transform the WBS into a Gantt chart, which shows tasks, duration, and dependencies along a timeline.
Research shows that a large portion (about 75%) of high-performing projects use software tools to manage details, resources, and progress. With tools like Gantt charts, spreadsheets, or visual boards, you can:
- Monitor the status of each work package
- See how delays affect downstream tasks
- Adjust workload and timelines as needed
For teams that prefer a simpler or more tabular approach, WBS can also live in spreadsheets or simple list views – the key is that it remains understandable and actionable for everyone involved.
Difference Between Project Network and WBS
Although a Work Breakdown Structure and a project network both deal with planning, they serve different purposes.
- A WBS focuses on what needs to be done. It’s a hierarchical breakdown of work and deliverables.
- A project network (often represented as a network diagram) focuses on when and how tasks relate to each other in sequence.
You can think of WBS as the “content” of the project (all the pieces of work), while the project network describes the flow of those pieces over time.
Another difference between a project network and a WBS is how they present information:
- WBS typically appears as charts, trees, spreadsheets, or structured lists representing the complete project scope.
- Project networks show dependencies and the sequence of work, often used to calculate critical paths and total duration.
In practice, both are complementary: you often start with a WBS to define the work, then develop a network diagram or schedule to sequence and time that work.
Types of WBS
There are two main WBS types in project management. This division is based on the elements incorporated in the top level of the WBS diagram. Let’s discuss this in detail.
Deliverable-Based WBS
In a deliverable-based WBS, the project is broken down by the things you will deliver – features, components, or outcomes.
You might start with major areas such as “Product Design,” “Implementation,” and “Launch,” then break these into smaller deliverables and work packages. This helps ensure that everything you’re doing directly ties back to a visible output or result.
This type is especially useful when stakeholders care deeply about specific deliverables and when sign-offs are tied to completed outputs.
Phase-based WBS
In a phase-based WBS, the top level is organized by project phases. Typically, these phases follow a lifecycle such as:
- Initiation
- Planning
- Execution
- Control/Monitoring
- Closeout
Within each phase, the work is then broken down into deliverables and tasks, similar to a deliverable-based WBS. The difference is simply how you structure the top layers.
Phase-based WBS is helpful when your organization or methodology is strongly phase-oriented (e.g., organizations that follow a formal stage-gate or PMBOK-style process).
Work Breakdown Structure Examples
Your WBS format should fit your project size, complexity, and team preferences. Below are three practical work breakdown structure examples that show how WBS can be represented in project management.
These formats can all support a WBS project management example, whether you’re working on software, construction, marketing campaigns, or internal change initiatives.
WBS Spreadsheet
A straightforward way to represent WBS is in a spreadsheet. Each row can represent:
- A deliverable
- A sub-deliverable
- A work package or task
Columns might include task name, WBS code, owner, start date, end date, and status.
Many project managers still use tools like Excel or Google Sheets to lay out WBS (see more details here) because they’re simple, flexible, and familiar. Studies show a significant portion of project managers still rely on spreadsheets to build resource and project plans.
A spreadsheet-based WBS is a good choice when:
- Your project is small to medium-sized
- The team prefers simple, table-based planning
- You want a quick starting point before moving to more advanced tools

WBS Flowcharts
Another way to visualize WBS is through flowcharts. Here, tasks and deliverables are represented as boxes connected by lines, showing the relationship between higher-level and lower-level work items.
Flowcharts work well when:
-
You want a highly visual representation of project structure
-
You need to explain the project to non-technical stakeholders
-
You’re building a WBS for training or communication purposes
Most WBS in project management can easily be sketched as flowcharts before being transferred into a scheduling tool. This makes them useful early in planning, when the structure is still evolving.

WBS Gantt Charts
Gantt charts are among the most popular formats for representing a Work Breakdown Structure in a time-based view. A WBS Gantt chart combines:
- A list (or tree) of tasks and deliverables
- A timeline showing their planned start and finish dates
- Dependencies between tasks
This gives you both structure and schedule in a single view.
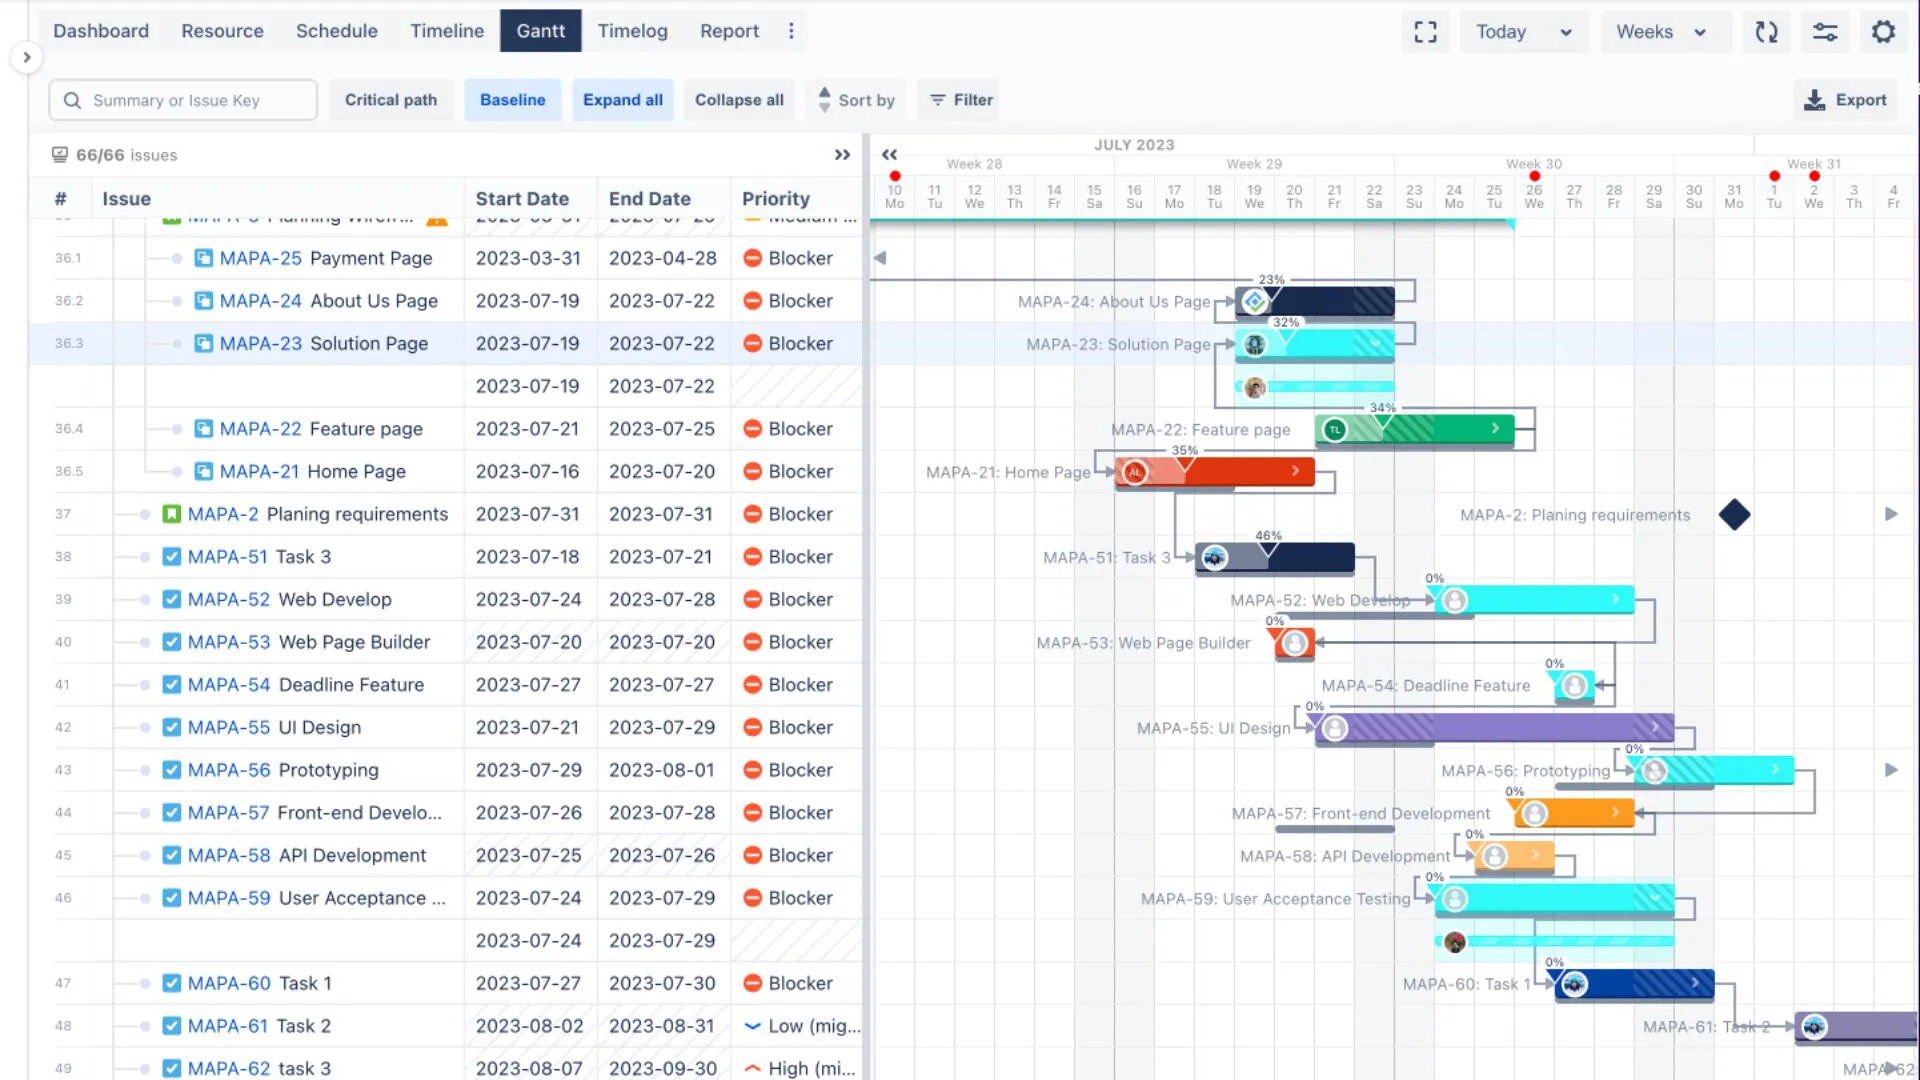
To design a productive WBS Gantt chart in Jira, tools like TeamBoard ProScheduler can be especially helpful. They allow you to:
- Build a visual WBS and link it directly to issues or tasks
- See workload, project status, and milestones at a glance
- Perform interactive time tracking and cost management
If you’re looking for a WBS project management example in a real-world tool, a WBS Gantt chart built in TeamBoard ProScheduler is a great place to start.
Conclusion
WBS is a practical and powerful project management tool for breaking down complex work into clear, manageable pieces. By organizing projects into phases, deliverables, and tasks, a Work Breakdown Structure helps teams execute more effectively, reduce risk, and improve communication.
You can create your WBS using Gantt charts, spreadsheets, flowcharts, or combinations of these formats — the best work breakdown structure examples are the ones your team can easily understand and use.
If you work in Jira and want a structured, visual way to plan and track work, tools like TeamBoard ProScheduler make it easy to build WBS Gantt charts, manage dependencies, and keep an eye on scope and workload in real time.
Now that you know what WBS stands for and what is a WBS in project management, you can start applying it to your own projects to bring structure, clarity, and control to your planning and delivery process.