As a project manager, you already know that your team’s most valuable resource isn’t your budget or your software stack – it’s time. Project management lives and dies by accurate data, and understanding exactly where your team’s hours are going is the only way to deliver sprints on schedule and keep stakeholders happy.
Yet, extracting a clean, actionable Jira time tracking report out of the platform often feels more like an administrative chore than a strategic advantage. While developers and designers are logging hours on individual tasks, managers are frequently left with fragmented data scattered across dozens of separate tickets and projects.
If you are tired of spending your Friday afternoons exporting messy spreadsheets just to see who worked on what, you are in the right place. This guide walks through exactly how to extract, build, and optimize time tracking reports in Jira—from native configurations to advanced, cross-project automation.
The drawbacks of manual Jira time tracking
Before we dive into building reports, it is important to understand why getting good data out of Jira can be so frustrating in the first place. If your reports look slightly “off” every week, it is usually because manual tracking workflows naturally introduce friction.
1. The administrative burden on teams
Let’s face it: nobody enjoys filling out timesheets. In fact, manual tracking requires your engineers or creatives to remember to log their hours against exact issue keys every single day.
Meanwhile, most people put this off until Friday afternoon, leading to a hurried, inaccurate data dump just to get the manager off their backs.
2. Human error and “guesstimation”
When time tracking isn’t intuitive, users log time based mostly on memory. A developer might guess they spent “about four hours” on a bug fix when in reality it took six.
As a result, this flawed data doesn’t just mess up the current week’s report; it actively compromises your ability to estimate future projects accurately. If you base next quarter’s roadmap on last quarter’s guesses, your timelines are most likely to be doomed from the start.
3. The invisibility of non-issue time
Manual tracking in native Jira is highly task-centric. More importantly, it ignores the internal overhead that silently erodes project profitability.
Besides, unexpected alignment meetings, internal training, replying to Slack messages, and general context-switching rarely have their own Jira tickets. Because there is nowhere to log this time natively, your team looks like they are underperforming on paper, when in reality, their capacity is simply being drained by invisible tasks.
If you want to avoid these nuisances of tracking time manually, you can read this article on how to make daily Jira time logging simple and accurate, and learn a thing or two.
What is a Jira time tracking report?
At its core, a Jira time tracking report is a data summary comparing your original project estimations against the actual execution time logged by your team. It is the definitive document that tells you if you are running ahead of schedule, burning through budget too quickly, or right on track.
To read these reports effectively, you need to understand three core metrics:
- Original Estimate: The initial benchmark time allocated to an issue or user story during sprint planning. This is your baseline.
- Time Spent: The total accumulated time logged by all assignees against that specific ticket so far.
- Remaining Estimate: The calculated buffer left to complete the work item (Original Estimate minus Time Spent).
For a project manager, this report is your early warning system. It empowers you to measure true project velocity, protect client margins from scope creep, and identify bottlenecks before they derail a deadline.
Most importantly, it helps you spot team members who are consistently logging overtime, allowing you to intervene and prevent burnout before it happens.
How to create time tracking reports in Jira natively
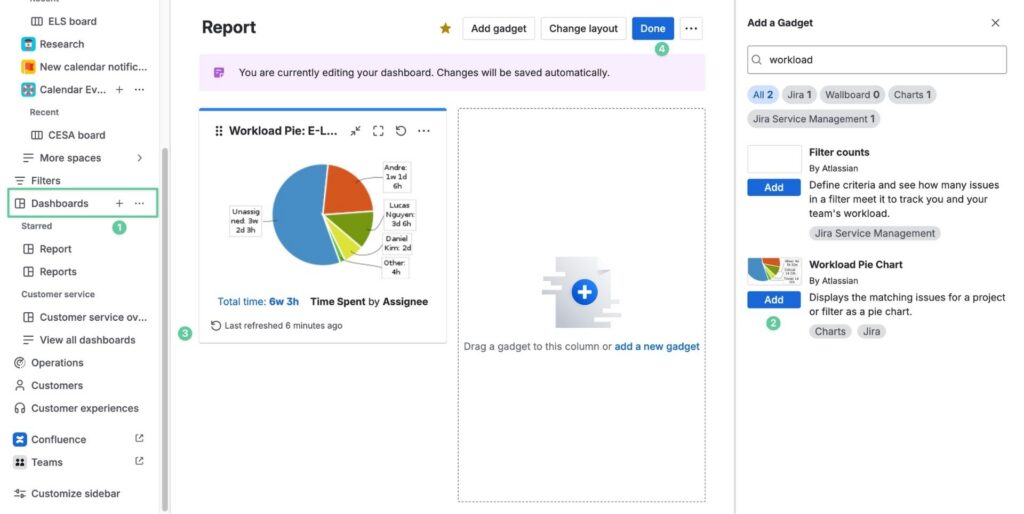
If you just need a quick data summary for a single project, Jira provides a built-in reporting tool using Dashboards. Here is a fast step-by-step guide to generating it:
- Navigate to the Dashboards section in your Jira workspace and create a new one.
- In the list of available Gadget templates, search for and select the Workload Pie Chart.
- In the Project or Saved Filter field, enter the exact name of the project you want to create the report for.
- Choose the metric of Statistic Type you want to use to group the dashboard data, such as Assignee, Category, or Parent.
- In the Time field to report on section, select one of three options based on what you need to track: Time Spent, Original, or Current Estimate.
- If you want your data to stay up to date without manual refreshing, select an appropriate value in the Refresh Interval field.
- Save your configurations and click Done to view your report.
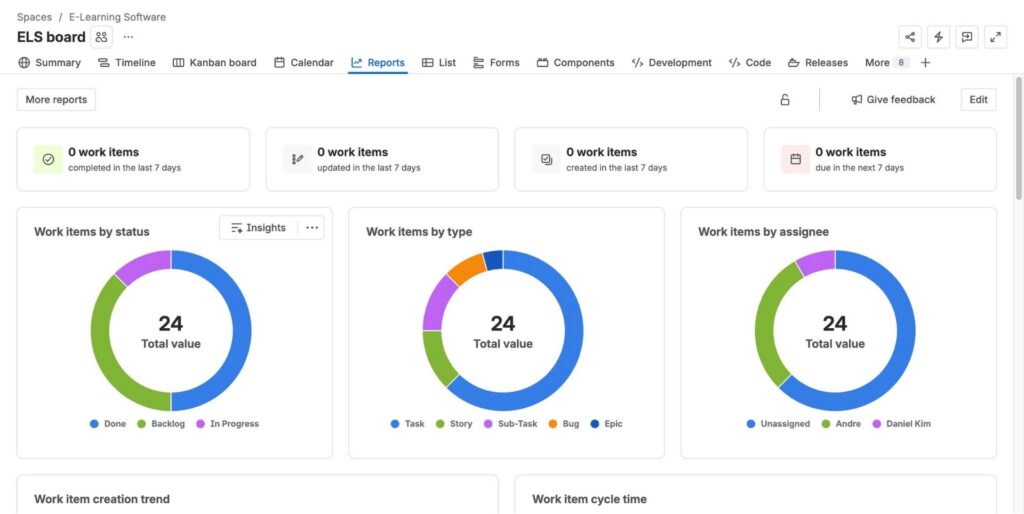
Or, you can make it even simpler by going to the Jira workspace you’re working on, then choosing the tab Reports from the header. You can also choose to view different chart types by clicking More reports.
Although the native Jira reports require simple setups, there’s a CATCH. Native reports lock you into just one project at a time. If your developers split their time across multiple projects, you cannot generate a single, unified report.
Moreover, Jira shows you the time logged by work item rather than giving you a clean, weekly calendar grid of time logged by person.
How to build a Jira time tracking report with TimePlanner
When you outgrow native Jira reporting, trying to merge multiple project exports in Excel is a massive waste of your time. This is where upgrading your workspace with a dedicated resource management app changes the game.
Using TimePlanner, you can bypass the clunky native limitations and instantly generate visual, cross-project reports. Here is how it streamlines the process.
Step 1: Choose the Report template you need
TimePlanner supports 3 different types of reports that you can choose from: General, Scheduled Time, and Logged Time reports.
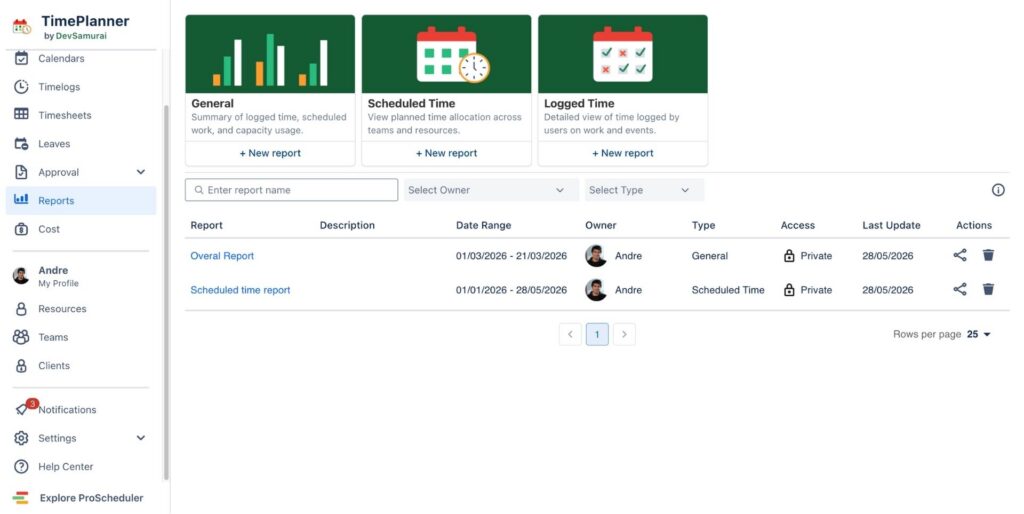
If you want a more complete view of which tasks are done or could be done, we recommend using the General report type for the best outcome.
Step 2: Centralizing multi-project data into a single grid
Instead of running five different reports for five different projects, TimePlanner aggregates logged hours across your entire Jira instance into a unified view. All you need to do is select the projects you want to include in the report.
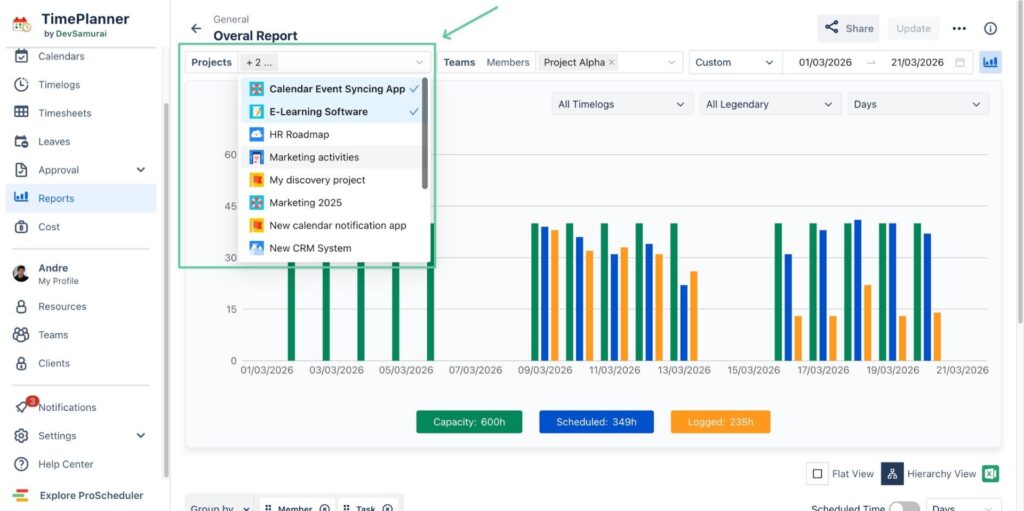
Additionally, you can choose to view the time tracking reports of specific members or a whole team in the same chart. This eliminates the single-project silos and gives you total visibility into the team’s actual workload.
Step 3: Tracking actual time logged against capacity
Native Jira tells you what was done, but it struggles to help you plan what can be done. TimePlanner introduces robust capacity planning alongside your time tracking interactively.
By hovering the cursor over a specific column, you can quickly view the scheduled vs logged time while comparing them with the full workload capacity for each day of the week. With this, managers can instantly spot budget-draining scope creep and prevent team burnout before it happens.
Step 4: Get detailed insights into each member’s tasks
TimePlanner’s reports also offer a granular breakdown of each team member’s time, combining their tracked tasks, active projects, and scheduled time-offs (leaves) into a single report.
And to make this data easily digestible, you can toggle between two distinct viewing modes depending on your immediate goal:
- Flat view: This mode strips away the noise and presents a clean, linear list of all logged time entries. It is perfect for rapid auditing, quick approvals, or scrolling through a chronological feed of what a team member accomplished during the week.
- Hierarchy view: This mode organizes your data into a structured tree, nesting individual task times under the parent of each task’s assignee. It is ideal when you need to see the bigger picture, allowing you to see exactly how an individual’s total time spent and daily efforts roll up into larger company initiatives and project milestones.
Step 5: Personalize your reports
The cherry on top when building a Jira time tracking report with TimePlanner is that you can deeply customize the report’s view. As mentioned above, TimePlanner supports 2 view modes, and you adjust the Hierarchy-view report using the Group By feature.
You can change how you want to view the report by selecting different Jira fields, Teamboard fields, and even Jira custom fields that are available in your instance. For example, if you prefer seeing the time spent on each stage of the project (and you’re using versions to manage those stages), you can choose the field called Fix Versions, accompanied by other fields to make a more comprehensible report.
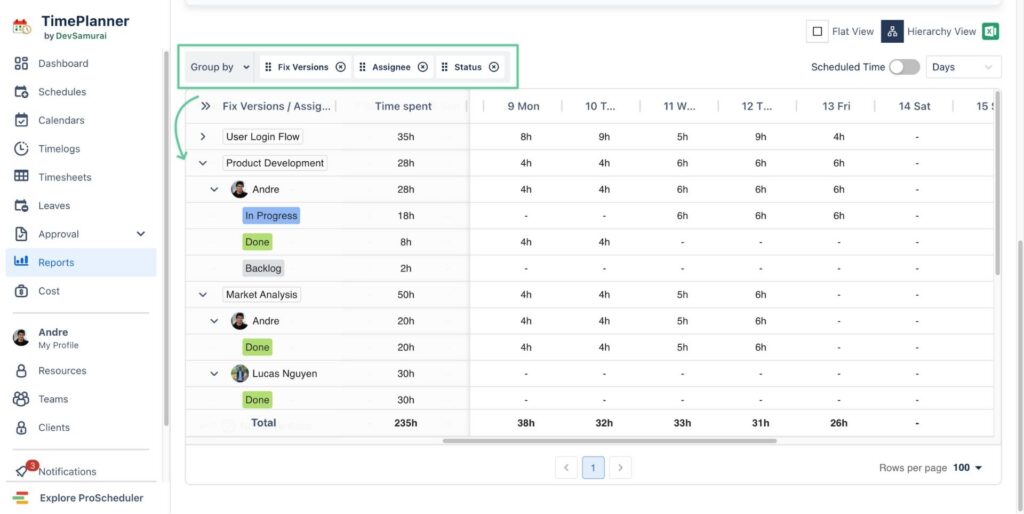
As a result, you can export a report that requires minimal explanation of how much time is spent on each stage of the project and who handled it.
Conclusion
Mastering time tracking in Jira is one of the most impactful things you can do to improve your project delivery. While Jira’s native reporting tools offer a decent starting point for basic, single-project tracking, manual workflows and siloed views will quickly cap your operational efficiency.
As your team grows and projects become more complex, you need a system that offers cross-project visibility and proactive resource management. Upgrading your approach transforms timesheets from a universally despised administrative chore into a powerful engine for accurate capacity planning and team health.