When it comes to managing a project effectively, having a clear and actionable plan is key. One of the most powerful tools in a project manager’s toolkit is the Gantt chart.
Whether you’re a seasoned project manager or just getting started, understanding Gantt charts is essential for creating organized, streamlined workflows.
What is a Gantt Chart?
A Gantt chart is a type of bar chart that represents a project schedule over time. It visually shows the tasks, their durations, and their dependencies, allowing you to see the overall project timeline and track progress easily. It’s like a visual roadmap that helps you keep track of every task and milestone in your project.
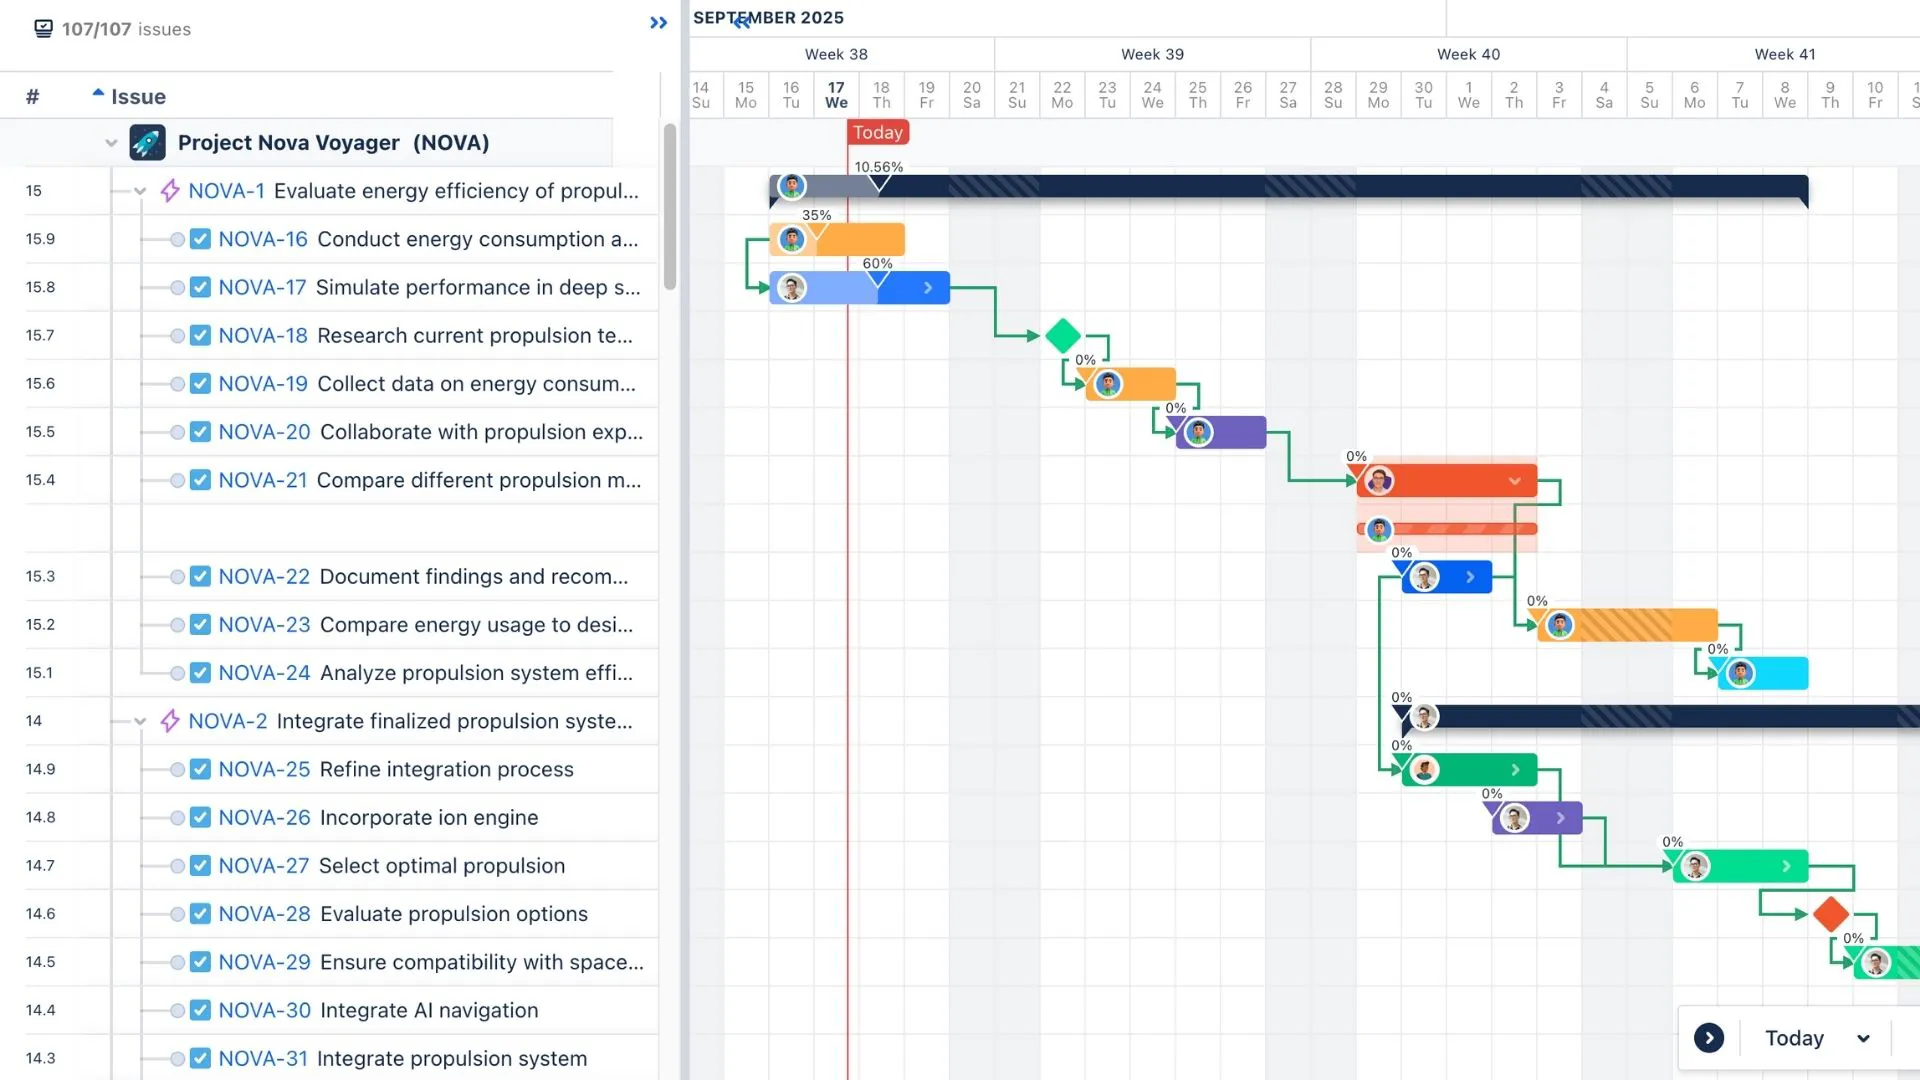
The chart itself consists of horizontal bars placed along a timeline. Each bar represents a task or activity within the project, with the length of the bar indicating the task’s duration. The timeline at the top of the chart shows when each task is scheduled to begin and end, providing a clear picture of how the project is progressing.
But Gantt charts are more than just a pretty visual. They also provide critical insight into a project’s structure and can be used to adjust plans if the project veers off course.
→ Related content: Why Visual Timelines Like Gantt Charts Help Teams Perform Better
History of the Gantt Chart
The Gantt chart was created in the early 20th century by Henry Gantt, an American engineer and management consultant. Gantt developed this tool to aid in planning and scheduling tasks in complex projects. His goal was to help managers visualize progress, make better decisions, and maintain control over the timeline.
Initially, Gantt charts were used to manage industrial production schedules, but over time, their utility became apparent in many other fields—particularly in project management. As businesses and organizations began to tackle more intricate projects, Gantt charts became essential for tracking multiple tasks, deadlines, and resources.
Today, the Gantt chart is a standard tool used by project managers across industries—from construction to software development.
Core Components of a Gantt Chart
To fully understand how a Gantt chart works, it’s important to break down its key components. These elements help make the Gantt chart an effective tool for managing projects.
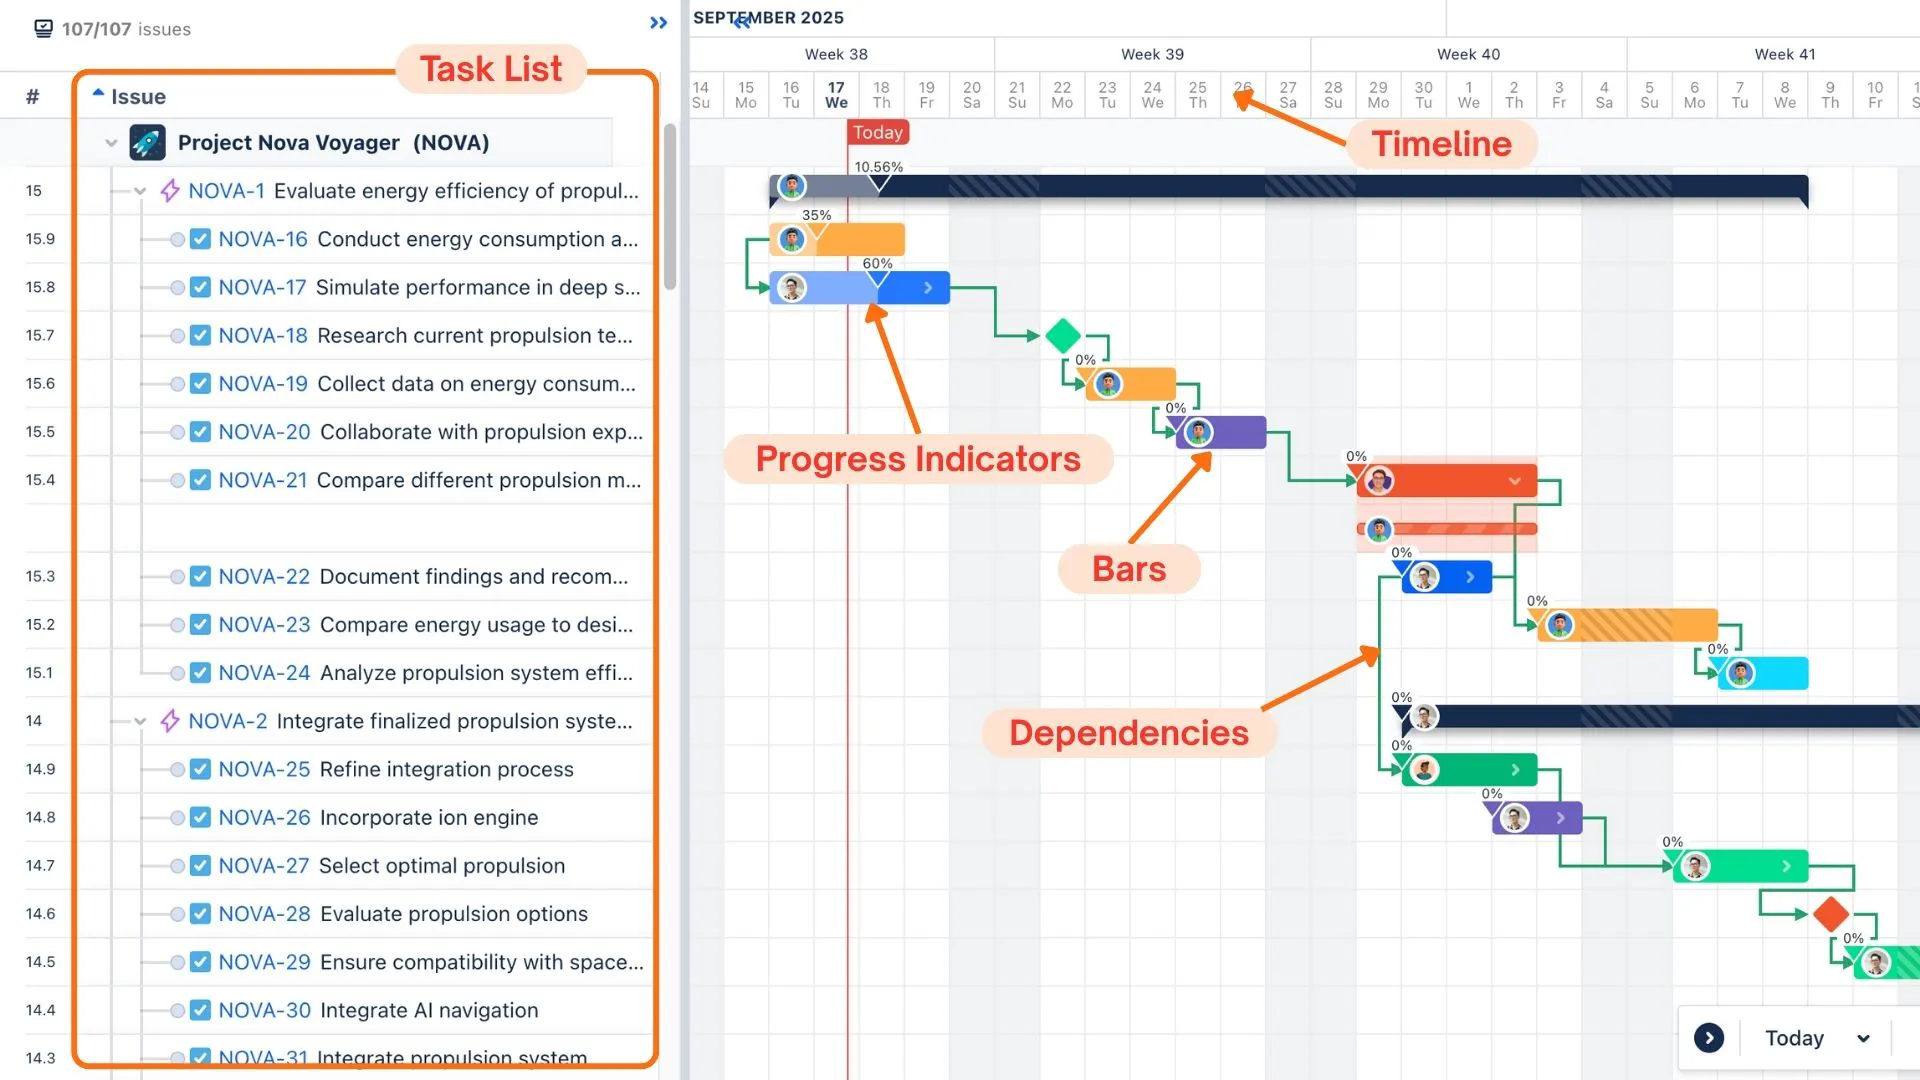
Task List
On the left side of the Gantt chart, you’ll find a list of all the tasks or activities that need to be completed for the project. Each task is represented as a row in the chart. This is where the project manager breaks down the work into actionable steps.
Timeline
The top of the chart typically displays a timeline that covers the entire project duration. This could range from days to months or even years, depending on the complexity of the project.
Bars
The main visual elements of a Gantt chart are the horizontal bars that represent tasks. The length of each bar indicates the duration of the task, and the position of the bar shows the start and end dates. This gives you a clear view of when each task will begin and finish.
Dependencies
Often, one task cannot start until another is finished. Dependencies between tasks are usually shown as arrows or lines connecting the tasks. These indicate the relationships between tasks, such as when a task is dependent on the completion of a prior task.
Progress Indicators
Many Gantt charts also include a way to track progress on tasks. This might involve shading or coloring the bars to reflect the percentage of the task that has been completed. It helps everyone involved understand how much work is left.
How to Create a Gantt Chart
Creating a Gantt chart may seem like a complex task, but it’s actually a simple and highly effective process.
Here’s a step-by-step guide to help you create your own Gantt chart, whether you’re using a tool like Microsoft Excel, Google Sheets, or project management software.
Step 1: List All Tasks
Start by listing all the tasks that need to be completed to finish your project. This might involve breaking larger tasks into smaller, more manageable subtasks. Be sure to include milestones and deadlines as part of your task list.
Step 2: Estimate Durations
Estimate how long each task will take. This could be in terms of hours, days, or weeks, depending on the scope of your project. Don’t forget to consider external factors like holidays, team availability, or potential delays that might impact the timeline.
Step 3: Identify Task Dependencies
Determine which tasks depend on others. For example, you can’t begin building a prototype until the design phase is completed. Identifying these dependencies is crucial because it helps you understand the order in which tasks need to be completed.
Step 4: Set Your Timeline
With your tasks and dependencies in mind, map out your timeline. In the Gantt chart, each task will be assigned to a specific time period, whether it’s days, weeks, or months.
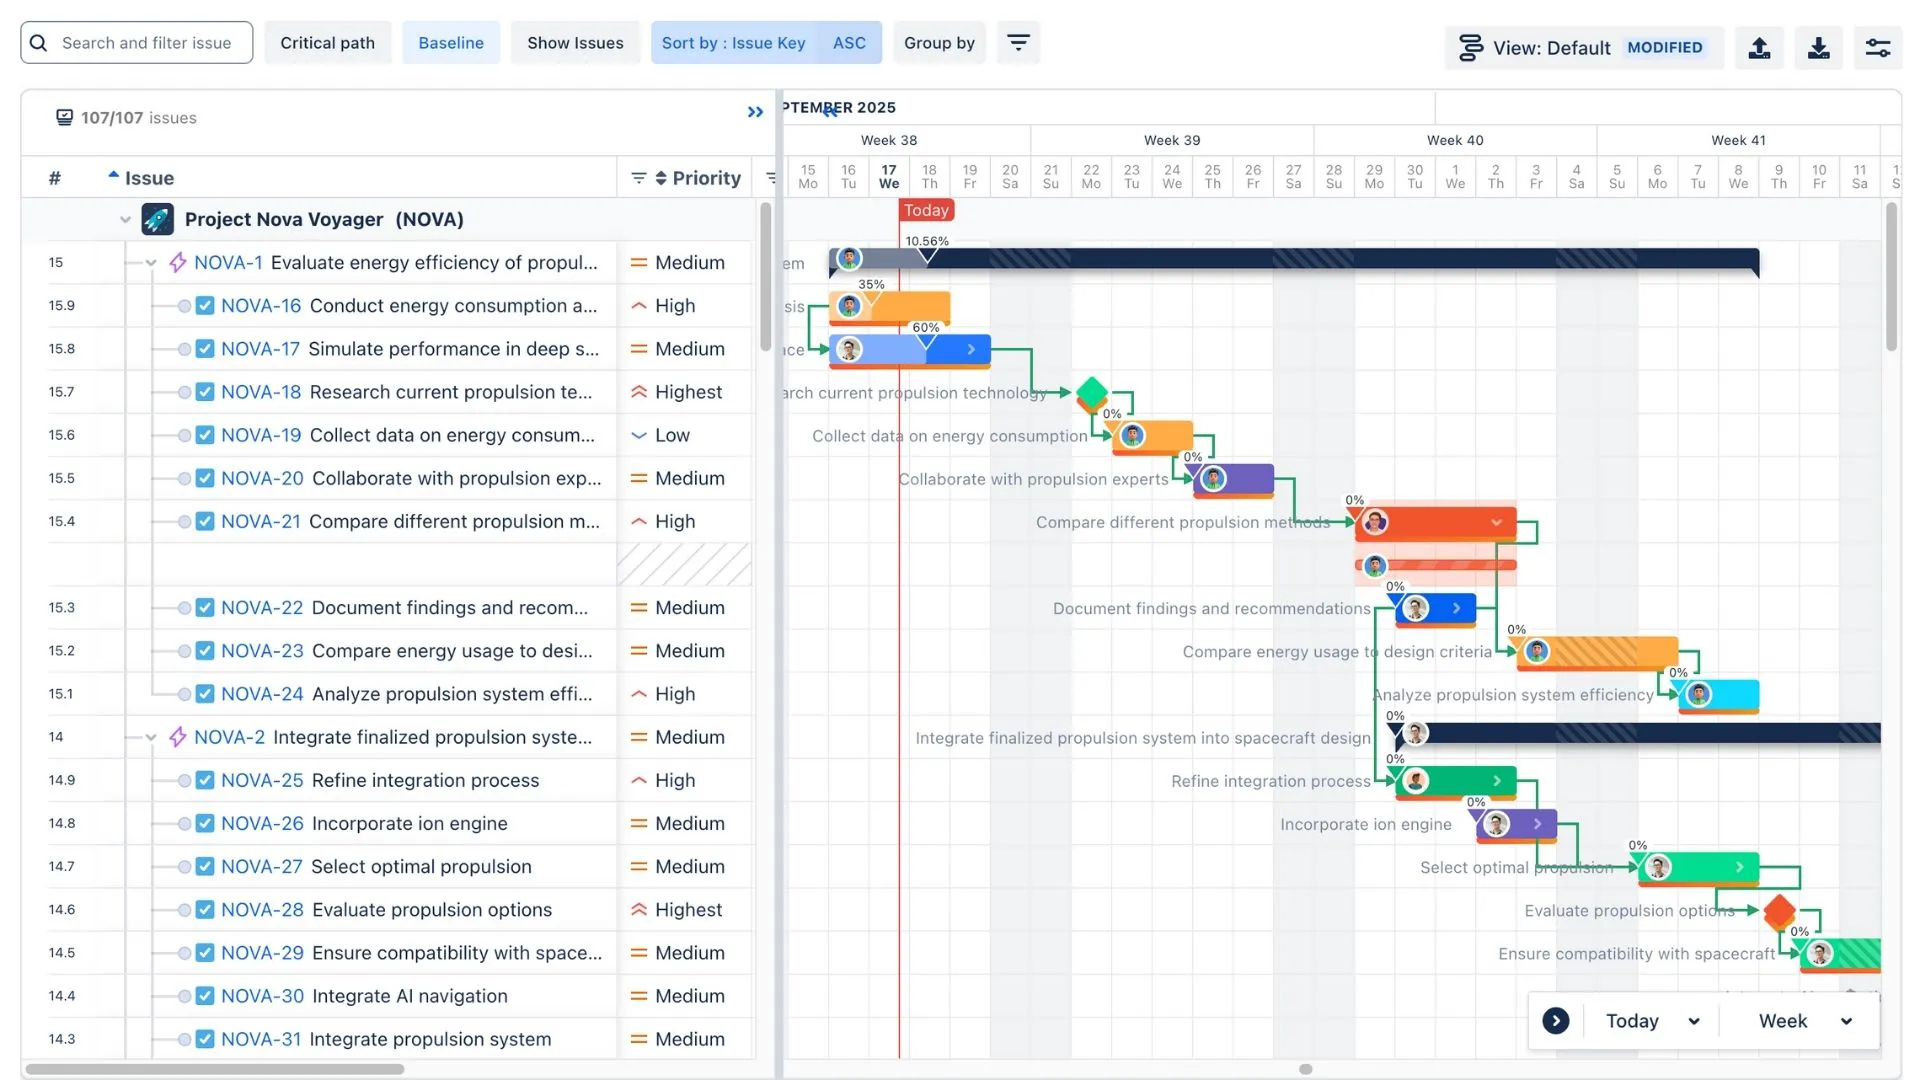
Step 5: Draw the Chart
Using your chosen tool (Excel, Google Sheets, or project management software like ProScheduler), create the Gantt chart by plotting the tasks, their durations, and the timeline. You can also add progress bars to track completion.
Step 6: Regular Updates
Finally, keep your Gantt chart updated regularly to reflect the latest progress, any changes to the schedule, or new tasks that may arise during the project.
→ Create a Gantt chart in Jira with ProScheduler
Pros and Cons of a Gantt Chart
Like any tool, Gantt charts come with their own set of advantages and challenges. Let’s take a look at both.
Pros of a Gantt Chart
- Clear Overview: One of the biggest advantages of a Gantt chart is the ability to get a visual overview of your entire project. It shows the timeline, all tasks, and their dependencies at a glance, making it easy to understand the project’s progress.
- Task Management: Gantt charts help project managers break down large projects into smaller, manageable tasks. This makes it easier to delegate responsibilities and track who is doing what.
- Progress Monitoring: As tasks are completed, the Gantt chart provides a clear indication of progress. This helps the team stay motivated and on track to meet deadlines.
- Improved Communication: A Gantt chart helps team members and stakeholders understand the project’s timeline and goals. It improves communication by providing a clear visual representation of the project status.
Cons of a Gantt Chart
- Rigid Structure: Gantt charts are best for projects with a defined scope and timeline. If your project is highly dynamic or if tasks change frequently, updating the Gantt chart can become a time-consuming task. In this case, using a story map is a better way to manage your project.
- Requires Regular Maintenance: To keep the Gantt chart useful, it needs to be updated regularly. If the project timeline changes or tasks are delayed, you’ll need to adjust the chart accordingly.
When to Use a Gantt Chart?
Knowing when to use a Gantt chart can significantly improve how you manage your projects. Here are a few scenarios where Gantt charts truly shine:
Managing Complex Projects with Multiple Tasks
When your project involves several interconnected tasks, a Gantt chart provides a clear overview of the entire workflow. It helps you see how tasks overlap, identify any dependencies, and keep track of task completion.
Visualizing Timeframes and Deadlines
A Gantt chart is an excellent tool for tracking when tasks need to start and finish. It’s especially useful when you have specific deadlines or milestones that need to be met.
By laying out the timeline visually, you can easily see if you’re on track or if certain tasks are falling behind schedule. This can help you adjust timelines or resources early enough to avoid delays.
Coordinating Task Dependencies
If your project has tasks that are dependent on others, Gantt charts can help you manage those relationships. For example, you might not be able to start one task until another is completed. By mapping out dependencies, a Gantt chart helps ensure that tasks are completed in the correct order and that nothing is overlooked.
Monitoring Project Progress
A Gantt chart is also a fantastic tool for tracking progress. As tasks are completed, you can update the Gantt chart to reflect the work that has been finished. This makes it easy to see how much work remains and whether the project is on target.
What Types of Teams Commonly Use Gantt Charts?
Gantt charts are widely used across industries because they provide such a clear and effective way to manage projects. Here’s a look at the types of teams that most commonly use Gantt charts:
Construction Teams
In construction, Gantt charts are especially helpful because they track many tasks that must occur in a specific order, such as foundation work, framing, electrical installations, and so on.
A Gantt chart allows construction managers to visualize the entire project’s timeline, identify which phases are dependent on others, and adjust the schedule as needed.
Software Development Teams
Software development projects can be complex and time-consuming, often requiring multiple phases like design, coding, testing, and deployment.
A Gantt chart helps break down the project into manageable tasks, showing when each task should be completed and how they relate to each other. Development teams can use the chart to track their progress, ensure all tasks are on schedule, and manage dependencies effectively.
Event Planning Teams
For event planners, Gantt charts are a go-to tool for keeping track of every aspect of an event, from venue booking and catering to marketing and guest lists.
A Gantt chart provides a clear timeline of when each task should be completed, helping event managers coordinate different elements smoothly and avoid last-minute rushes.
Marketing Teams
Marketing campaigns often involve a mix of creative tasks (like content creation) and strategic tasks (like paid advertising or product launches).
A Gantt chart helps marketing teams stay organized by mapping out the timeline for each part of the campaign. Whether you’re working on a social media campaign, product launch, or email marketing, using a Gantt chart allows your team to visualize when different components of the campaign should happen, ensuring nothing is missed and the project moves forward smoothly.
Gantt Chart Best Practices
To get the most out of your Gantt chart, consider these best practices:
- Keep it Simple: Don’t overcomplicate the chart. Focus on the tasks that are most important for the project’s success.
- Break Tasks Into Smaller Steps: Larger tasks can overwhelm the team. Breaking them down into smaller tasks makes them easier to manage and track.
- Update Regularly: Make sure to keep the Gantt chart updated regularly. If tasks change, the chart should reflect those updates.
- Use Colors for Clarity: Color coding tasks can help differentiate between phases of the project or indicate the status of tasks (completed, in-progress, etc.).
- Be Realistic with Timelines: It’s easy to underestimate how long tasks will take. Make sure your time estimates are realistic to avoid pushing deadlines back too far.
Conclusion
A Gantt chart is an essential tool in the world of project management, offering a clear, visual way to track tasks, timelines, and progress. It’s a simple but powerful way to stay organized and ensure that everyone involved in the project is on the same page.
While Gantt charts come with a few challenges, their benefits far outweigh the drawbacks. By following best practices and using the tool effectively, you can take your project management skills to the next level.
So, whether you’re managing a small team or a large project, try incorporating a Gantt chart into your workflow. It might just be the tool you need to keep things running smoothly.