Managing projects—big or small—can quickly get complicated. Deadlines, dependencies, shifting priorities, and team communication all matter. That’s why so many teams turn to visual timelines like Gantt charts. These charts take complex plans and turn them into clear, easy-to-follow visuals that help everyone stay on track.
If you’ve ever wondered why these tools are so effective, this article will explain not just what Gantt charts are but why they work from a psychological perspective. Plus, we’ll share practical tips on implementing them and how tools like TeamBoard ProScheduler can boost Jira teams’ productivity.
Understanding Gantt Chart: A Powerful Visual Project Management Tool
A Gantt chart is essentially a project timeline. Imagine a bar chart where each bar represents a task, showing when it starts, how long it will take, and when it ends. Tasks that depend on others are linked, revealing the project’s full flow.
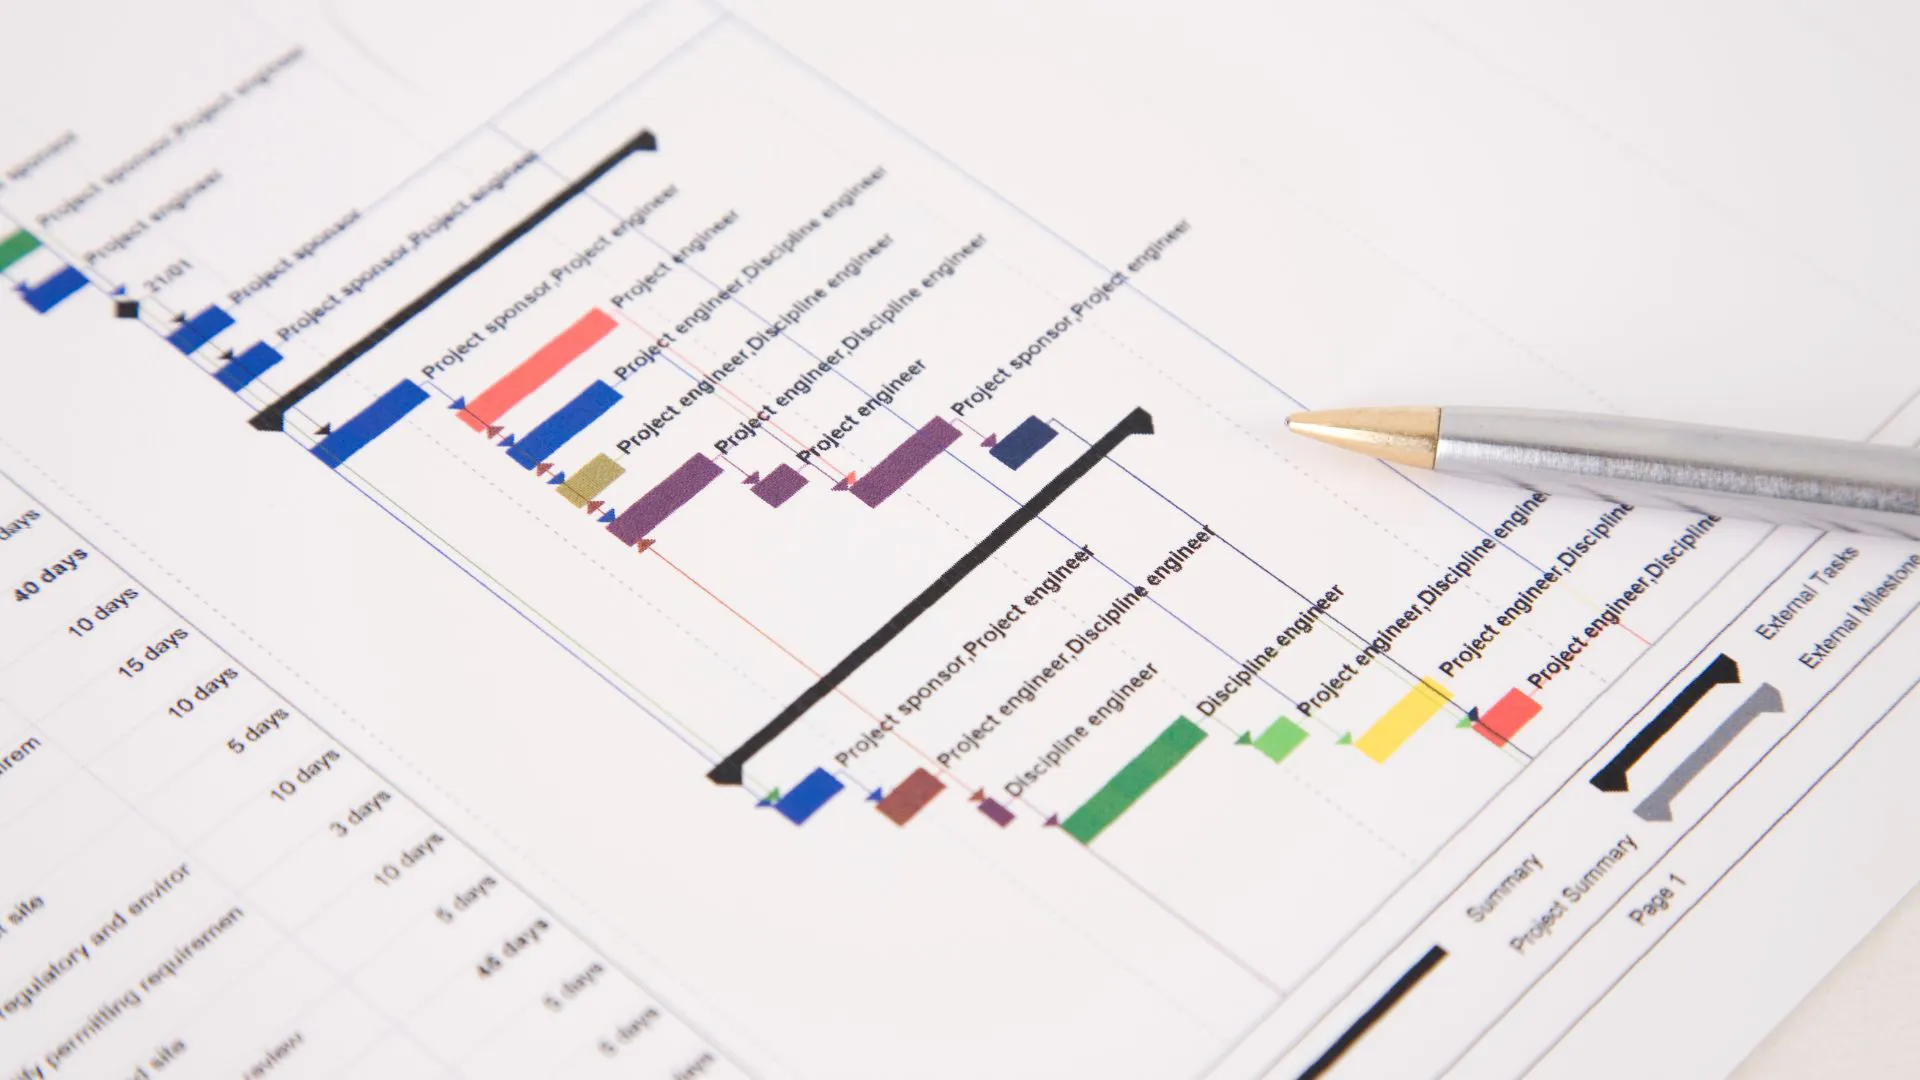
Created in the early 1900s by Henry Gantt, these charts have stood the test of time because they make it simple to see the big picture. No matter your industry—whether construction, marketing, software development, or events—the visual format helps break down complex schedules.
Why is that useful? Because seeing tasks visually instead of buried in text makes planning more straightforward. Everyone can understand what’s happening, what’s next, and where things might overlap or need extra attention.
The Psychology Behind Visual Planning
Let’s explore why visual tools like Gantt charts help teams perform better, not just organizationally but mentally.
Cognitive Benefits of Visual Representation
Our brains handle images far better than large blocks of text. A Gantt chart chunks information into sections that can be easily grasped at a glance.
This externalizes memory and reduces mental overload, letting teams focus on executing rather than constantly recalling every detail.
Enhancing Focus and Motivation
Seeing progress visually with milestones and timelines works like motivation magnets. It provides short-term goals, so instead of facing a huge unknown, team members see achievable steps.
Visual reminders reduce procrastination by keeping upcoming tasks top of mind, encouraging people to start and finish their work on time.
Facilitating Communication and Alignment
A shared visual timeline creates a common understanding. When everyone can see the same plan, there’s less room for misunderstandings. Discussions become clearer because everyone refers to the same concrete information.
This shared mental model helps teams stay aligned and coordinate more easily.
Stress Reduction and Confidence Building
Ambiguity breeds stress. When people don’t know what’s expected or when things are due, anxiety rises.
Visual plans clarify what needs to happen and when. They help teams spot problems like bottlenecks early, so surprises are less likely, and confidence in hitting deadlines grows.
Accountability and Responsibility
Gantt charts assign clear ownership for tasks and deadlines visible to all. This transparency encourages team members to take responsibility and meet commitments because their contribution is publicly tracked and valued.
Knowing someone is counting on you drives reliability.
Distribution of Cognitive Load
By using charts as an external memory, teams free up mental bandwidth. This allows more thought for problem-solving and creativity instead of just remembering what’s next.
Visualizing workloads also helps balance task distribution, preventing burnout by showing when someone has too much on their plate.
Implementing Gantt Charts for Maximum Productivity
To get the full benefits of Gantt charts, here’s how to approach implementation:
- Define Clear Tasks and Milestones: Break your project into individual, manageable tasks with specific deadlines and goals.
- Set Dependencies: Identify which tasks can only start after others finish to avoid bottlenecks.
- Choose the Right Tool: Use user-friendly software that allows easy updates and collaboration.
- Keep It Updated: A Gantt chart is only as good as its accuracy. Regularly update progress and changes.
- Review With the Team: Make the visual timeline a regular part of meetings for transparency and joint problem-solving.
- Be Flexible: Projects evolve—adjust your chart when priorities shift or new information arises.
How Gantt Charts Help Jira Teams
Jira is a powerhouse for software development and project management teams, but by default, it lacks a native Gantt chart feature. That’s where integrations and apps like TeamBoard ProScheduler come in, bringing the power of visual timelines right into the Jira environment.
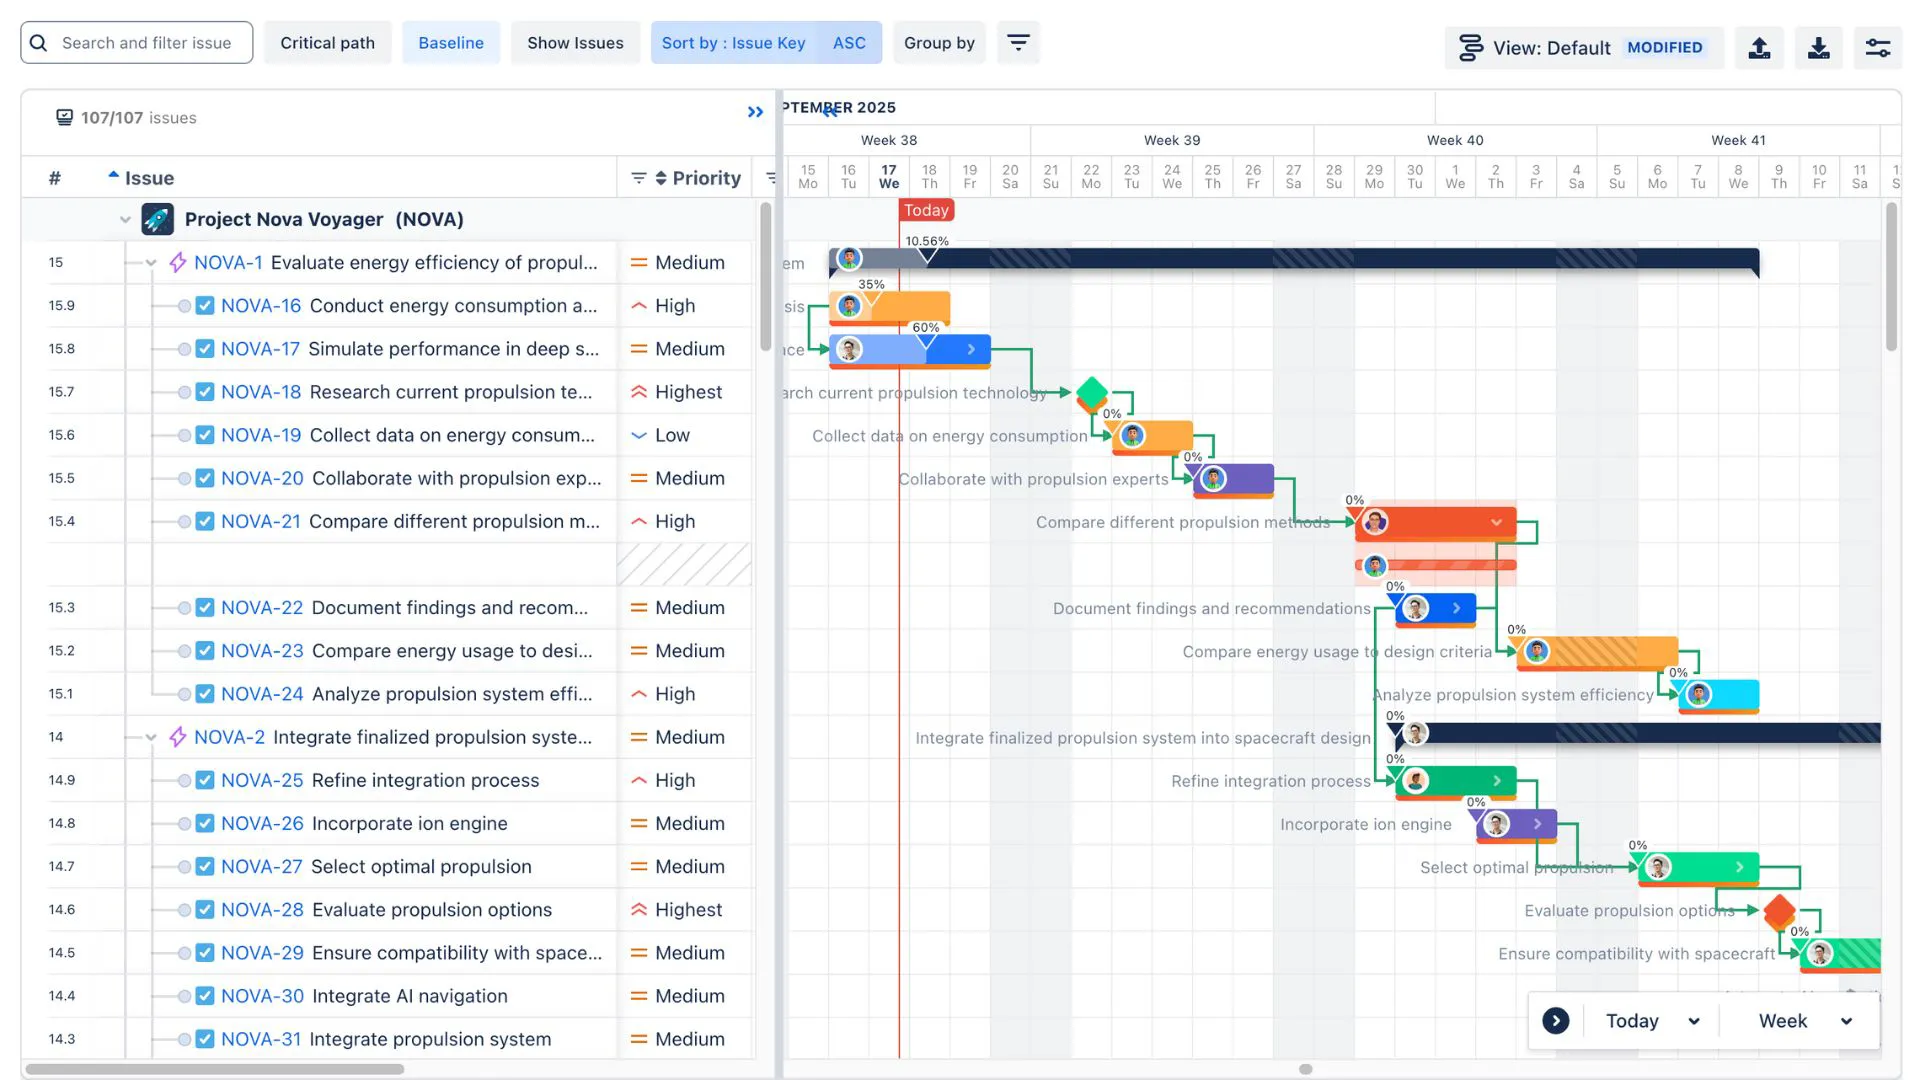
What TeamBoard ProScheduler Adds to Jira
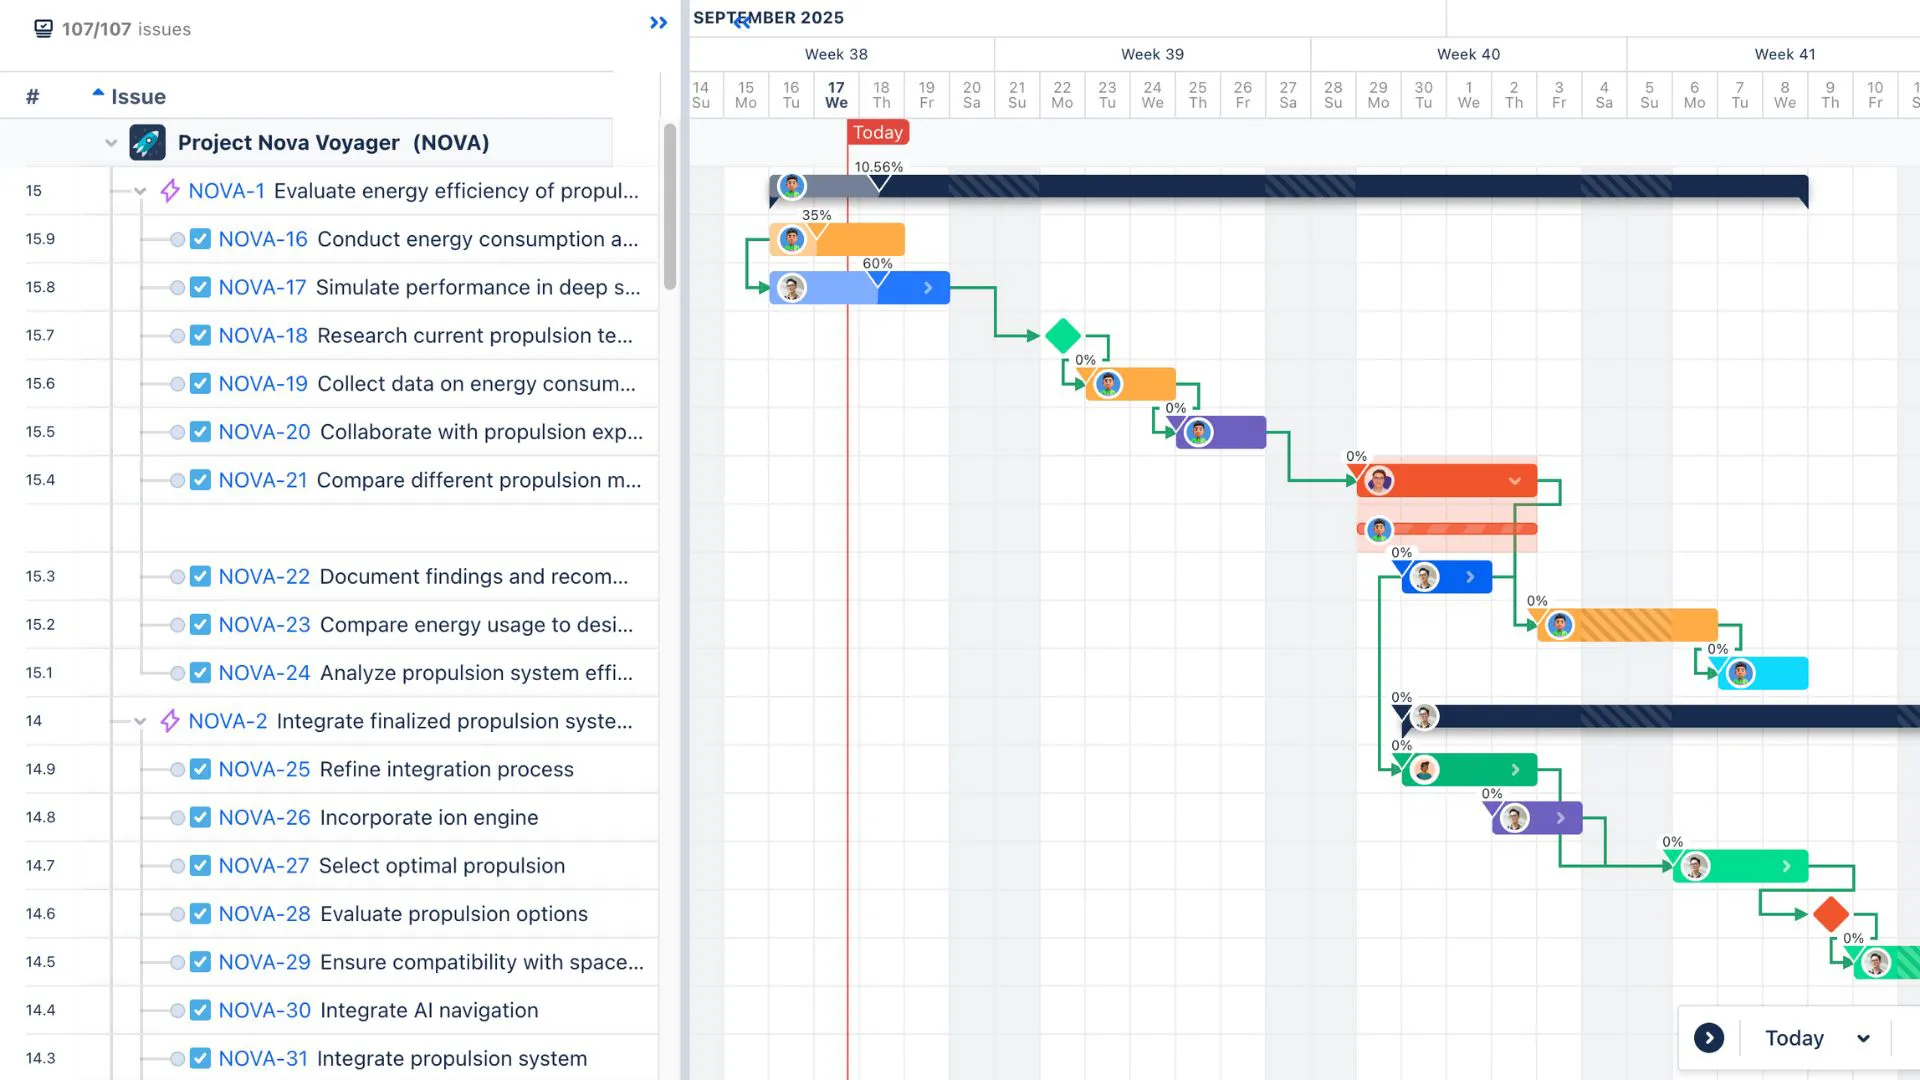
TeamBoard ProScheduler fills this gap by providing seamless Gantt chart functionality directly connected to Jira tasks. Here’s how it helps teams:
- Real-Time Project Visibility: Changes made in Jira instantly update the Gantt chart and vice versa, so the timeline always reflects current progress.
- Managing Dependencies: Easily link and visualize task dependencies to avoid delays and plan more effectively.
- Resource Allocation: See who’s assigned to what and balance workloads, so no team member is overwhelmed.
- Timeline Adjustments: Drag and drop tasks to shift deadlines, with smart rescheduling automatically updating dependent tasks.
- Collaboration Made Simple: Team members get a clear, unified visual plan to refer to, improving communication and reducing confusion.
Why This Matters for Jira Teams
Agile teams often focus on sprints and backlogs, which can make long-term planning more challenging. Using TeamBoard ProScheduler’s Gantt charts lets teams bridge that gap by visualizing timelines across multiple sprints and releases. It helps teams think beyond day-to-day tasks to the bigger project goals.
Plus, with remote and distributed teams becoming the norm, having one clear shared visual plan reduces misalignments and keeps everyone accountable.
Similar Visual Planning Tools
Gantt charts aren’t the only way to visualize work. Depending on your needs, you might also find these tools helpful:
- Story Mapping: Focuses on arranging tasks or user stories to show a product’s feature flow from a user perspective. It helps product teams prioritize what to build next in a way that’s easy to follow.
- Kanban Boards: Use columns to show task stages like To Do, In Progress, and Done. Kanban boards are great for continuous workflows where you want to limit how much work is happening simultaneously.
While Gantt charts give a time-focused overview, story maps and Kanban boards cater more to task prioritization and flow management. Using these tools together often provides a well-rounded approach.
Best Practices to Boost Team Performance Using Gantt Charts
To wrap it up, here are practical tips to get the most from Gantt charts:
- Start your planning with clear, measurable goals.
- Keep tasks broken down so progress is easy to track.
- Use colors or labels to highlight priorities and risks.
- Update your chart regularly—stale charts lose value.
- Review timelines with your team often to keep everyone aligned.
- Combine Gantt charts with other tools like Kanban boards to handle different planning needs together.
- Encourage open communication so any delays or issues are flagged early and addressed quickly.
Conclusion
Visual timelines like Gantt charts do much more than organize tasks—they tap into how our brains best process and retain information. By breaking projects down visually, they help teams stay focused, motivated, and aligned. Tools like TeamBoard ProScheduler bring this clarity right into Jira, making it easier than ever for agile teams to balance short-term work with long-term goals.
When teams rely on visual planning, they reduce stress, boost accountability, and improve communication. Whether planning your next software release or managing complex projects across multiple teams, visual timelines can be a game-changer.
Start using Gantt charts today, and watch your team navigate projects with more confidence and success.